The Billionaire Raj
India's top 1% holds 40.1% of national wealth. A data-first look at wealth concentration, tax incidence, and household debt.
Introduction
India had one dollar billionaire in 1991. By 2022, it had 162. Their combined wealth now sits at roughly a quarter of the country's entire net national income. This piece traces three separate datasets — wealth concentration, tax incidence, and household debt — that turn out to describe the same underlying mechanism from three different angles.
The concentration, in numbers
The World Inequality Lab's long-run series on India (1922–2023), led by researchers including Thomas Piketty, Nitin Kumar Bharti, Lucas Chancel, and Anmol Somanchi, finds that income and wealth inequality in India declined for decades after independence, bottoming out around the early 1980s, before reversing sharply — a reversal that accelerated after 1991 liberalization and again through the 2000s and 2010s.
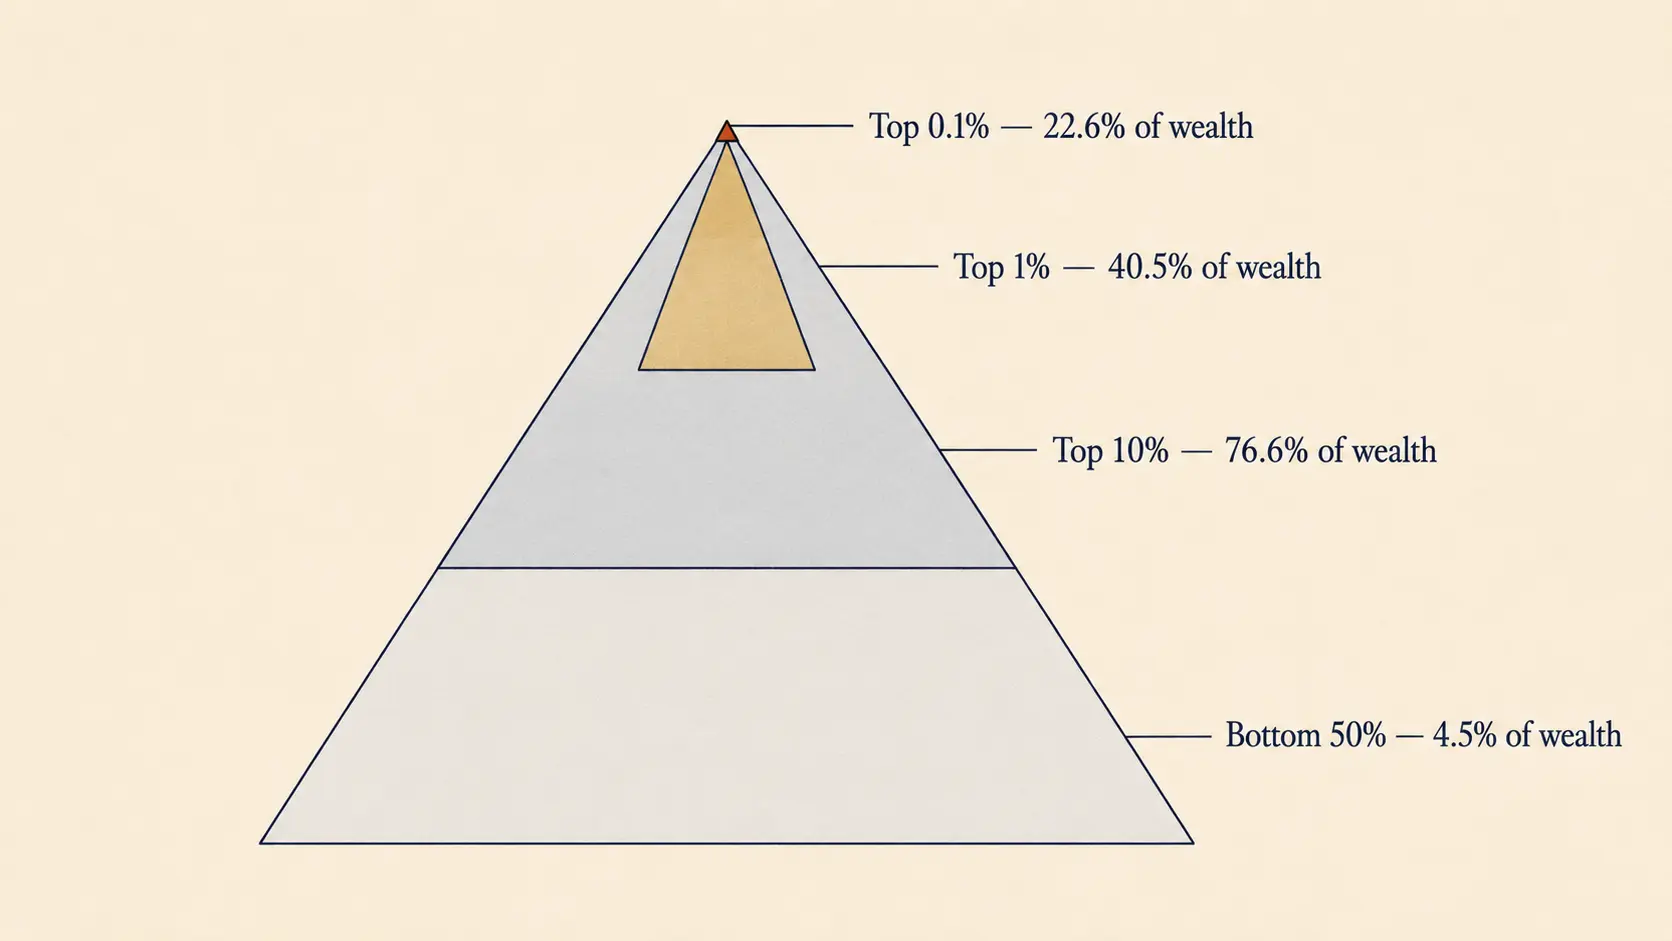
By 2022–23: the top 1% held 22.6% of national income and 40.1% of national wealth. The top 10% held 57.7% of income and 65.0% of wealth. The middle 40% held 27.3% of income and 28.6% of wealth. The bottom 50% held 15.0% of income and just 6.4% of wealth.

The concentration compounds further at the very top: within the top 1%, the top 0.1% holds 29.7% of national wealth, and the top 0.001% — just 9,223 individuals — controls 16.8% of total national wealth, with average net wealth exceeding ₹2,261 crore each. The aggregate wealth-to-income ratio for the country rose from 3.83 in 1995 to 5.75 in 2022, meaning national wealth has grown substantially faster than national income over that period — a hallmark of an economy where capital returns are outpacing labor income growth.
The researchers behind this series describe the current level of concentration as exceeding, by some measures, the inequality of the colonial-era "British Raj" — a comparison made in their own published work, not an exaggeration layered on afterward.
The tax system: progressive on paper, uneven in practice
India's direct taxes — personal income tax, corporate tax, capital gains — are genuinely progressive, with high earners contributing a disproportionate share of direct tax revenue. The regressivity shows up elsewhere.
Indirect taxes fall harder on lower-income households as a share of income. GST and fuel excise apply regardless of income level, and because lower-income households spend nearly all of what they earn, almost every rupee passes through some tax rate. Wealthier households save and invest a meaningful share of income, shielding that portion from consumption tax entirely.
A NIPFP incidence study, using CMIE's Consumer Pyramids Household Survey data across consumption fractiles, adds a subtler layer: GST exemptions on essential goods (roughly 24.5% of average monthly per capita consumption expenditure falls in the 0% exempted category) provide a larger absolute rupee benefit to higher-income households, since their total consumption basket is bigger even at the same 0% rate. Lower rate slabs (5%) skew progressive in relative benefit; the "out of GST" category — fuel and alcohol — places a proportionally larger burden on higher-consumption households due to vehicle ownership and energy use patterns. The net picture: GST is regressive as a share of income for the poor, and its exemptions are regressive in absolute benefit toward the top — both true within the same tax system.

At the very top, the regressivity is sharper still. When tax paid is measured against net wealth rather than income, wealthy individuals pay comparatively little — a function of low capital and wealth taxation, generous exemptions on certain asset classes, and corporate structuring options unavailable to salaried households. Wealth, the fastest-growing base in India's economy, is also the base least directly taxed.
The debt economy absorbing the gap
While wealth concentrates at the top, household debt has climbed for everyone else. RBI Financial Stability Reports and related analyses put household debt at roughly 41–42% of GDP by 2024–25, up from around 38% five years earlier. The number of household borrowers nearly doubled in under a decade — from about 12.8 crore in 2017–18 to 28.3 crore by 2024–25 — and household financial liabilities rose from roughly ₹3.8 lakh crore in FY2015 to ₹18.8 lakh crore in FY2024, before moderating slightly.

A recent distressed-borrower survey found EMI payments consume most or all household income for about 60% of respondents, with many relying on new loans or credit cards specifically to service existing debt. The composition matters: non-housing retail loans — personal loans, credit cards, consumer durables, buy-now-pay-later — make up more than half of household borrowing, while home loans (the asset-building kind) account for a smaller share, around 29–36%.
It's worth noting a genuine data discrepancy here: one investigation in this research places household debt at just 18.4% of GDP as of March 2026, a figure that conflicts sharply with the 41–42% range cited across multiple RBI-sourced reports. The higher figure is corroborated by more independent sources — RBI Financial Stability Reports, financial media analysis, and borrower-count data all converge around 40%+ — so it's treated as the more reliable figure here, with the lower one flagged as either a different underlying metric or a reporting error rather than quietly resolved one way.
India's household debt-to-GDP ratio, even at 41–42%, remains lower in aggregate than in the US or most of Europe, where the figure often exceeds 60–80%. The concern isn't the level. It's the direction and composition — a rising share of unsecured, consumption-driven credit rather than debt tied to building an asset, concentrated among borrowers with the least capacity to absorb a shock.
The connecting mechanism
None of these three patterns requires coordination between them. Wealth compounds fastest for those already holding productive, appreciating assets — equity, business ownership, urban real estate. The tax system, built around income and consumption rather than wealth, doesn't meaningfully slow that compounding even as it takes a real, disproportionate bite out of spending at the bottom. And the resulting gap between rising living costs and flat real wages gets filled, increasingly, with unsecured debt rather than closed through wage growth or asset accumulation.
Three separate government-adjacent research efforts — a long-run wealth study, a tax incidence study, a financial stability report — converge on the same underlying shape without needing to reference each other. That convergence is the actual evidence here, more than any single statistic in isolation.
FAQ
How much wealth does India's top 1% control? 40.1% of national wealth and 22.6% of national income, as of 2022–23, according to the World Inequality Lab's long-run series — among the highest concentrations recorded globally.
Is India's tax system progressive or regressive? Both, depending on which tax. Direct taxes (income, corporate) are progressive. Indirect taxes (GST, fuel excise) are regressive as a share of income for lower earners, while exemptions on essentials provide larger absolute benefits to higher-income households. At the very top, taxation relative to net wealth is comparatively low.
How much is India's household debt as a share of GDP? Most RBI-sourced reporting puts it at roughly 41–42% by 2024–25, up from about 38% five years earlier — though this research surfaced one conflicting figure of 18.4%, flagged here as a likely different metric or data error rather than resolved.
Is India's household debt level a crisis? The aggregate level remains lower than in the US or much of Europe. The concern is composition and trend — a growing share of unsecured, consumption-driven borrowing and rising distress among borrowers with limited buffer capacity, rather than the headline ratio itself.
Related Writing
- business strategy
Six Months, Twelve Domains, One Uncomfortable Conclusion
Six months of deep research into India's institutions reveals interconnected systemic failures, real successes, and six high-leverage reforms.
- business strategy
Why Your Central Bank Wants Some Inflation
The RBI targets 4% inflation, not zero. Why that target exists, who bears the cost, and what CPI vs CFPI reveals.
- business strategy
What I Actually Think About India's Next Decade
Closing a 10-week series on Indian institutions, I drop the hedging and say plainly what I believe about reform, timing, and the decade ahead.
- business strategy
The Billionaire Raj: What India's Inequality Actually Costs
India's top 1% income share now exceeds colonial-era levels. This essay examines the specific economic costs of that concentration.
- business strategy
Trust as Infrastructure: Why India's Low Social Capital Is an Economic Problem
Trust functions like infrastructure, not just culture. Why India's low generalized trust raises transaction costs, and how institutions—not culture—can fix it.