Vitaliq: Health, Simplified
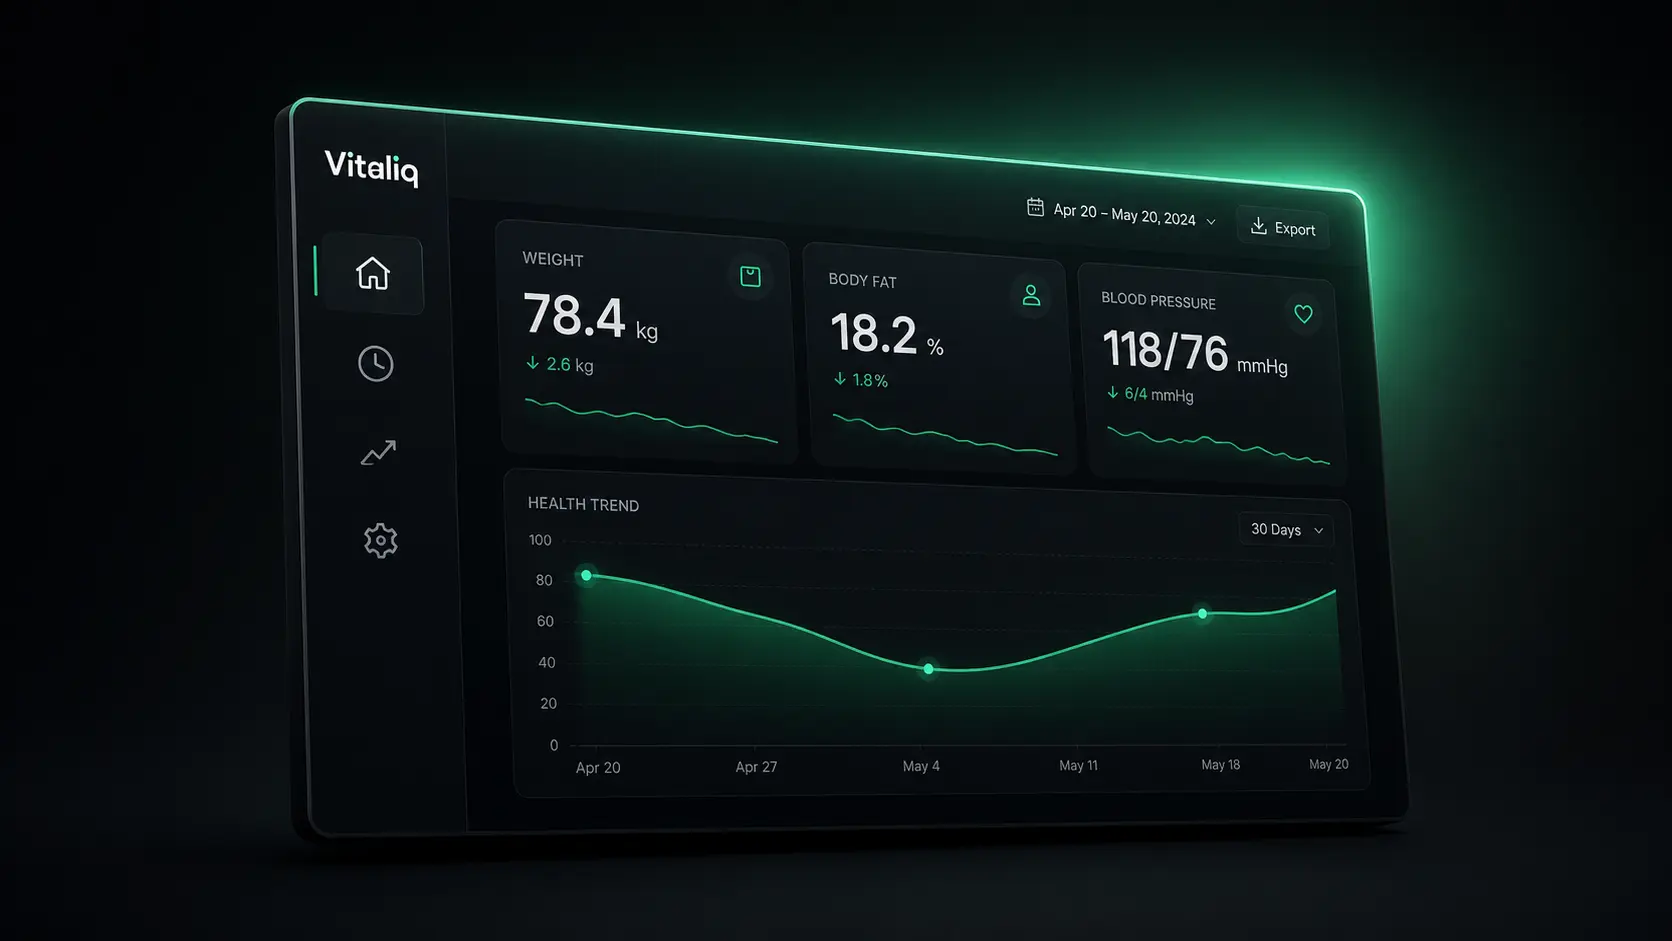
Long Description
Vitaliq started as a personal problem: tracking body composition, blood pressure, and blood glucose in a Google Sheet, with formulas standing in for a real data model. That works until it doesn't — no multi-device sync worth trusting, no real validation, no way to ask "is this trend actually meaningful or just noise" without doing the math by hand.
The project became an exercise in taking a personal tool seriously as a piece of software: a real multi-user architecture, a real database, a statistics layer that can tell the difference between a genuine trend and measurement noise, and an insights engine that explains why it's surfacing something rather than just showing a number. None of it uses machine learning — every insight traces back to a concrete, readable rule (a 3% weight change over 30 days, a blood pressure reading over 130/80, a five-day logging streak). That was a deliberate choice: explainability over cleverness.
What makes it distinctive as a portfolio piece isn't any single feature — it's the discipline in how it was built. A strict Repository → Domain → Server Action layering was imposed early specifically so persistence could change without touching business logic, and it was tested for real: partway through development, the entire database was swapped from Supabase to Neon + Drizzle ORM, and the swap required zero changes to the Domain layer or Server Actions. That's the kind of architectural bet that either pays off or doesn't, and this one did.
Vitaliq is explicitly not a medical diagnostic tool — it's a personal analytics platform for people who want to see their own health data as a story instead of a spreadsheet.
Product Overview
From a user's perspective, Vitaliq is a small set of focused screens:
- Dashboard — a daily snapshot: current weight, body fat, and blood pressure as stat cards with sparklines, plus the top three ranked insights the system has generated from your recent history.
- Trends — a health-domain-grouped analytics workbench (Weight Journey, Body Composition, Cardiovascular Health, Metabolic Health) with a global time-range selector, moving-average overlays, goal reference lines, and a "What's Changed?" summary banner.
- History — every logged measurement, searchable and paginated, color-coded by category.
- Settings — profile, goals, and unit/timezone preferences.
A visitor who isn't ready to sign up can hit Try Demo on the landing page and land directly inside a fully populated account — ten months of realistic, narrative-driven data for a fictional persona (a weight-loss and metabolic-health journey with real plateaus and a real setback), generated deterministically rather than with random noise.
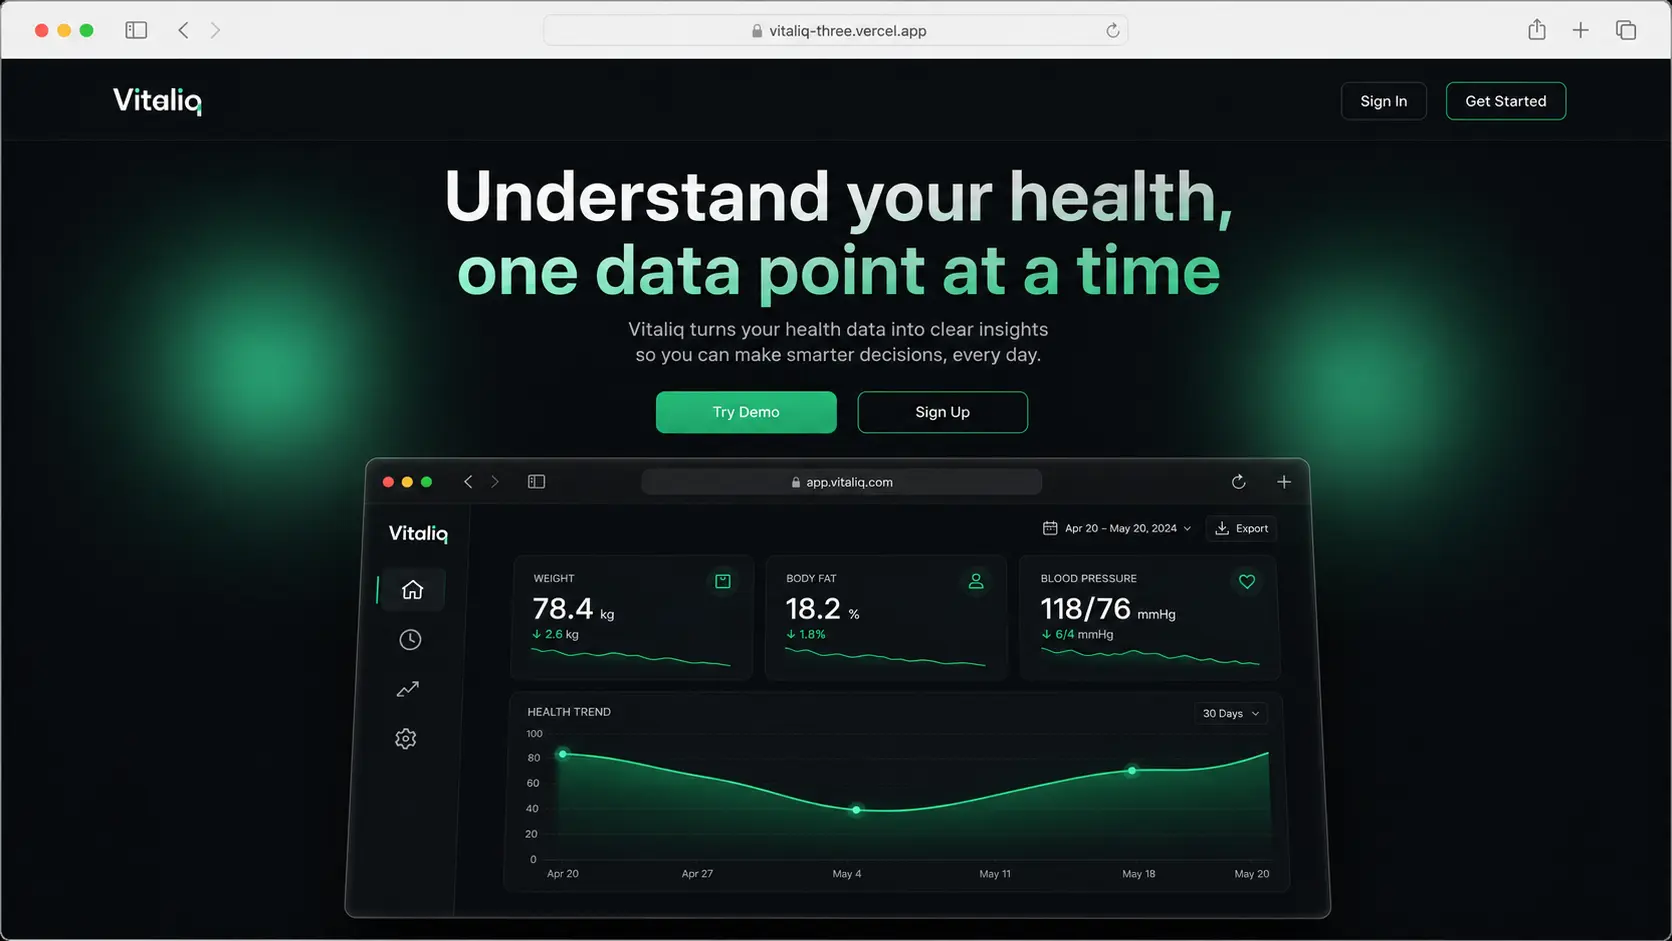 The public landing page — a smart-routed root path that serves marketing content to guests and redirects signed-in users straight to their dashboard.
Key Features
Multi-metric health tracking Body composition (weight, BMI, body fat %, muscle rate, water %, bone mass, BMR, and more — 14 fields from smart-scale-style input), blood pressure (systolic/diastolic/pulse), and blood glucose, each with its own repository, validation schema, and category classification (e.g., BMI category, BP category) computed at read time rather than stored.
Deterministic, explainable insights A rule-based insights engine — not a black box — surfaces inactivity alerts, goal-milestone insights (50/80/100% progress and regressions), significant weight changes (≥3% over 30 days), blood pressure and glucose threshold alerts, and logging streaks. Every insight is anchored to a reference date so results stay deterministic and testable, and the top three are prioritized by severity for the dashboard.
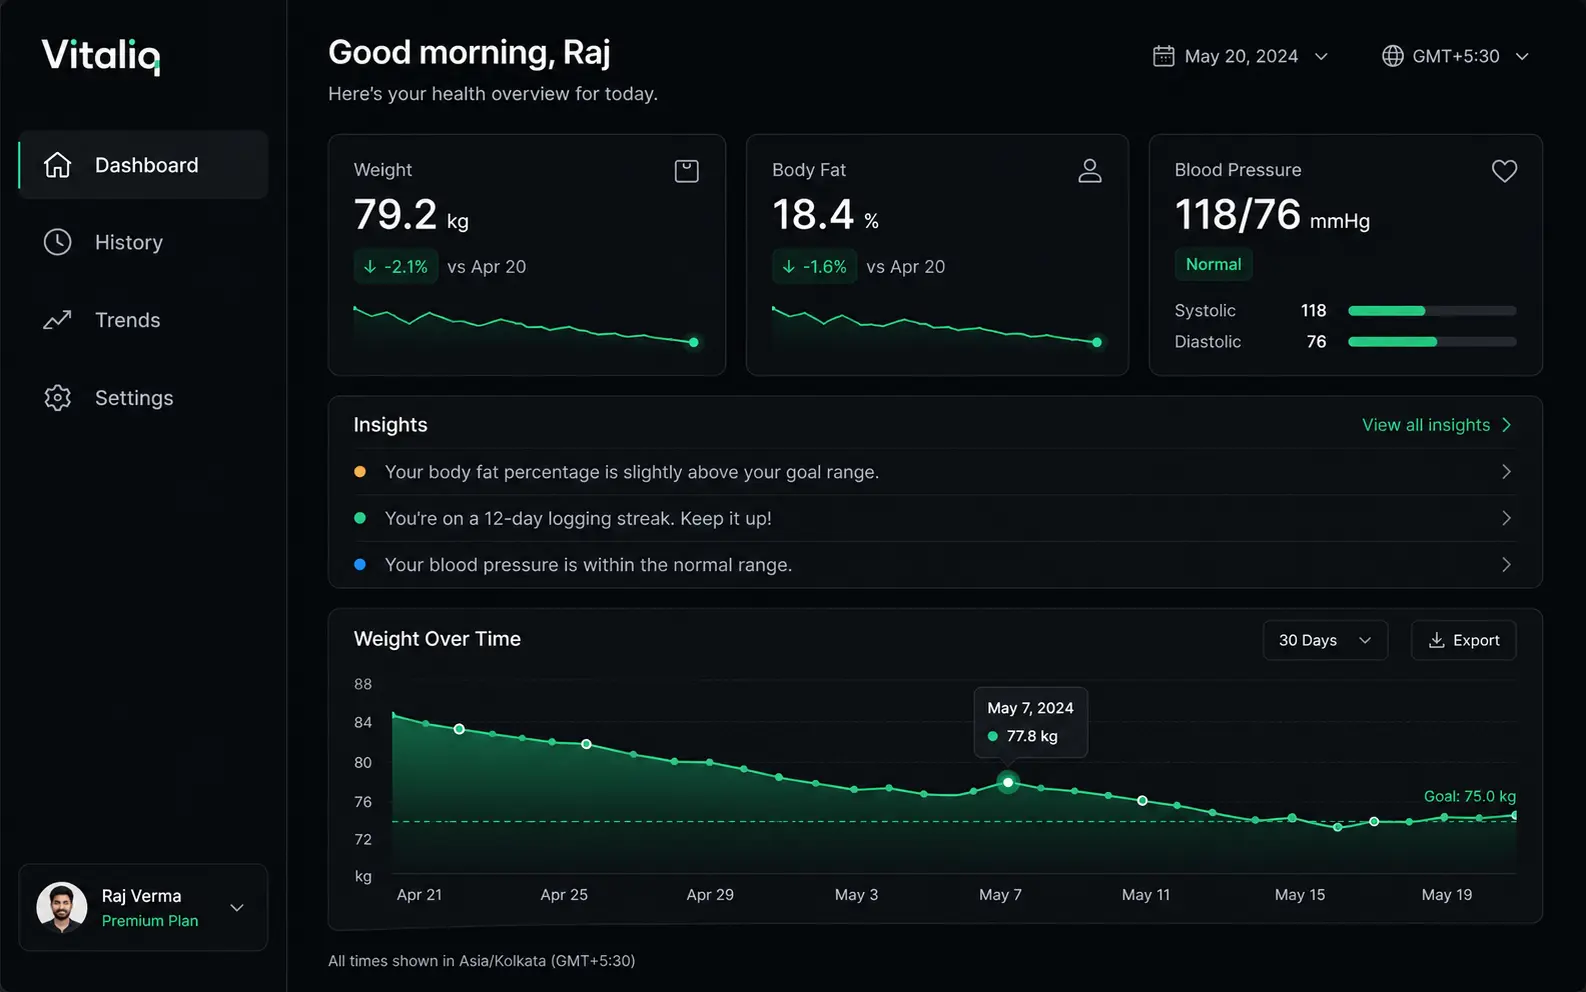 The Dashboard — server-computed stat cards, ranked insights, and a primary trend chart.
A health-domain-grouped Trends dashboard Rather than a flat list of 18 individually-selectable metrics, Trends is organized the way a person actually thinks about their health: a Weight Journey story, a Body Composition breakdown, Cardiovascular Health, and Metabolic Health — each with its own chart treatment, all driven by one global time-range selector.
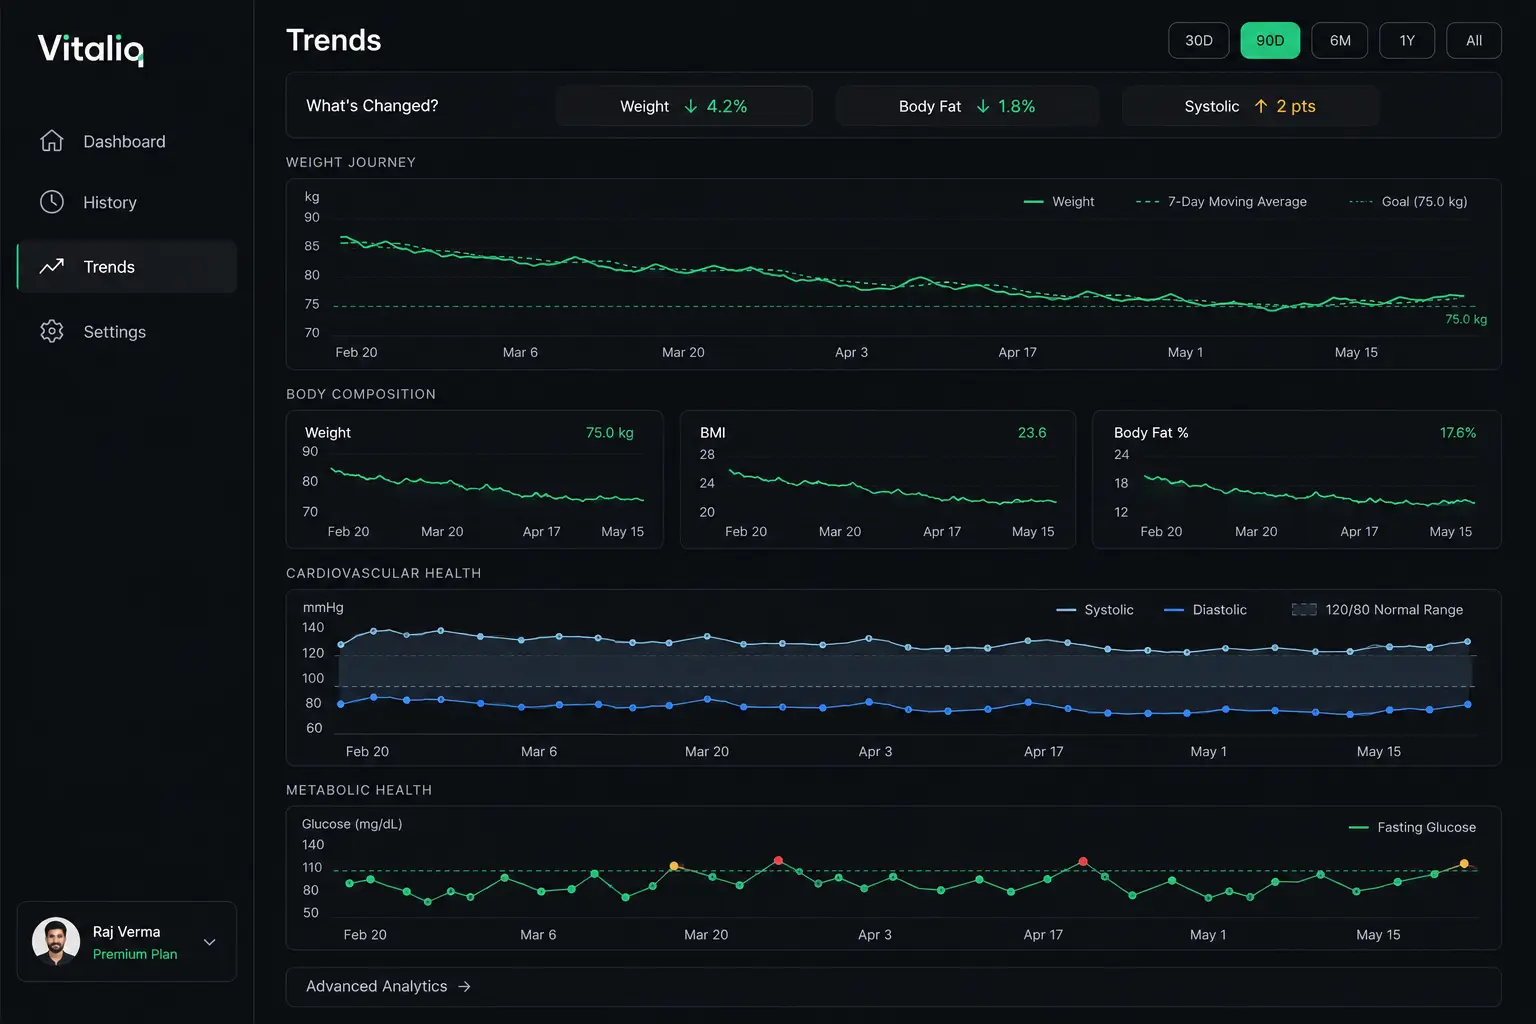 Trends, redesigned around health domains instead of a flat metric list, with a "What's Changed?" summary banner.
A purpose-built blood pressure visualization Blood pressure is shown as a paired systolic/diastolic composed chart with a shaded normal-range band, instead of two independent line charts — a small decision that noticeably improves at-a-glance readability of pulse pressure and in-range status.
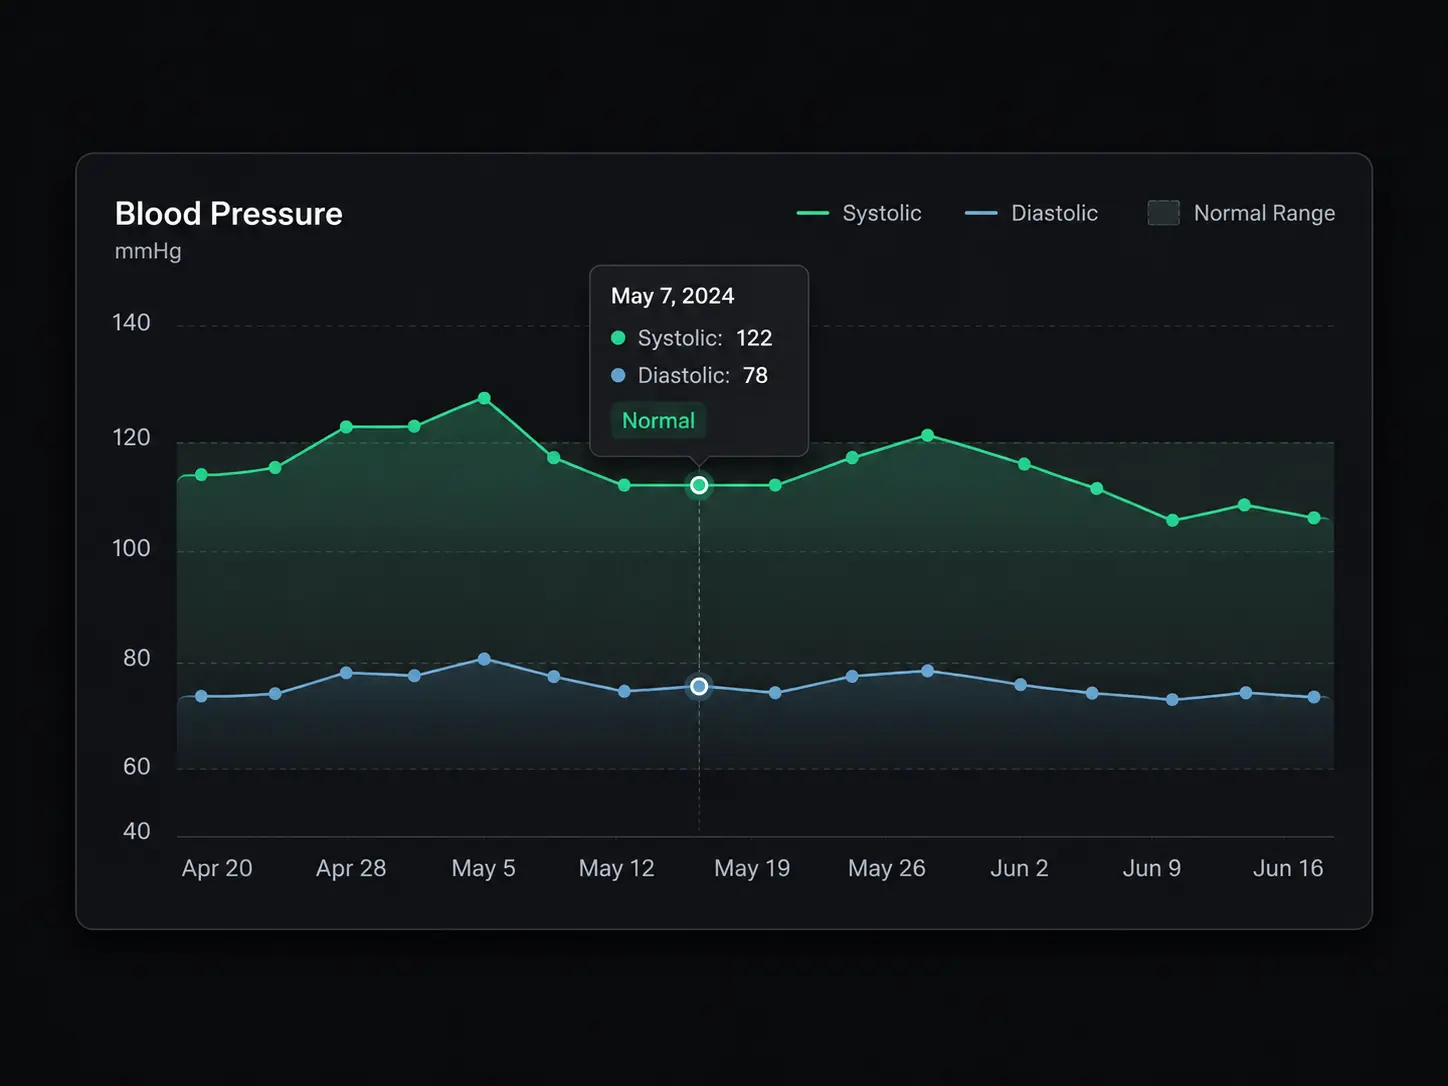 Paired systolic/diastolic visualization with a shaded reference band, chosen over two separate lines for readability.
A deterministic, story-driven demo account A seeded PRNG-based generator produces ~550-600 realistic records across a five-phase narrative (small improvements → strong progress → plateau → a temporary setback → recovery) for a fictional persona, seeded through the same repository layer as real user data — no separate demo-only code path for persistence. The demo login itself uses Clerk's Sign-In Tokens API to mint a short-lived, one-time token server-side, rather than exposing a shared password or bypassing authentication.
Fully responsive, with real mobile interaction patterns Desktop gets a side panel for editing entries; mobile gets a focus-trapped, swipe-friendly slide-up drawer with safe-area-inset padding and Escape-to-close. Desktop navigation lives entirely in the sidebar; mobile adds a sticky top header with account management so the bottom tab bar can stay dedicated to navigation.
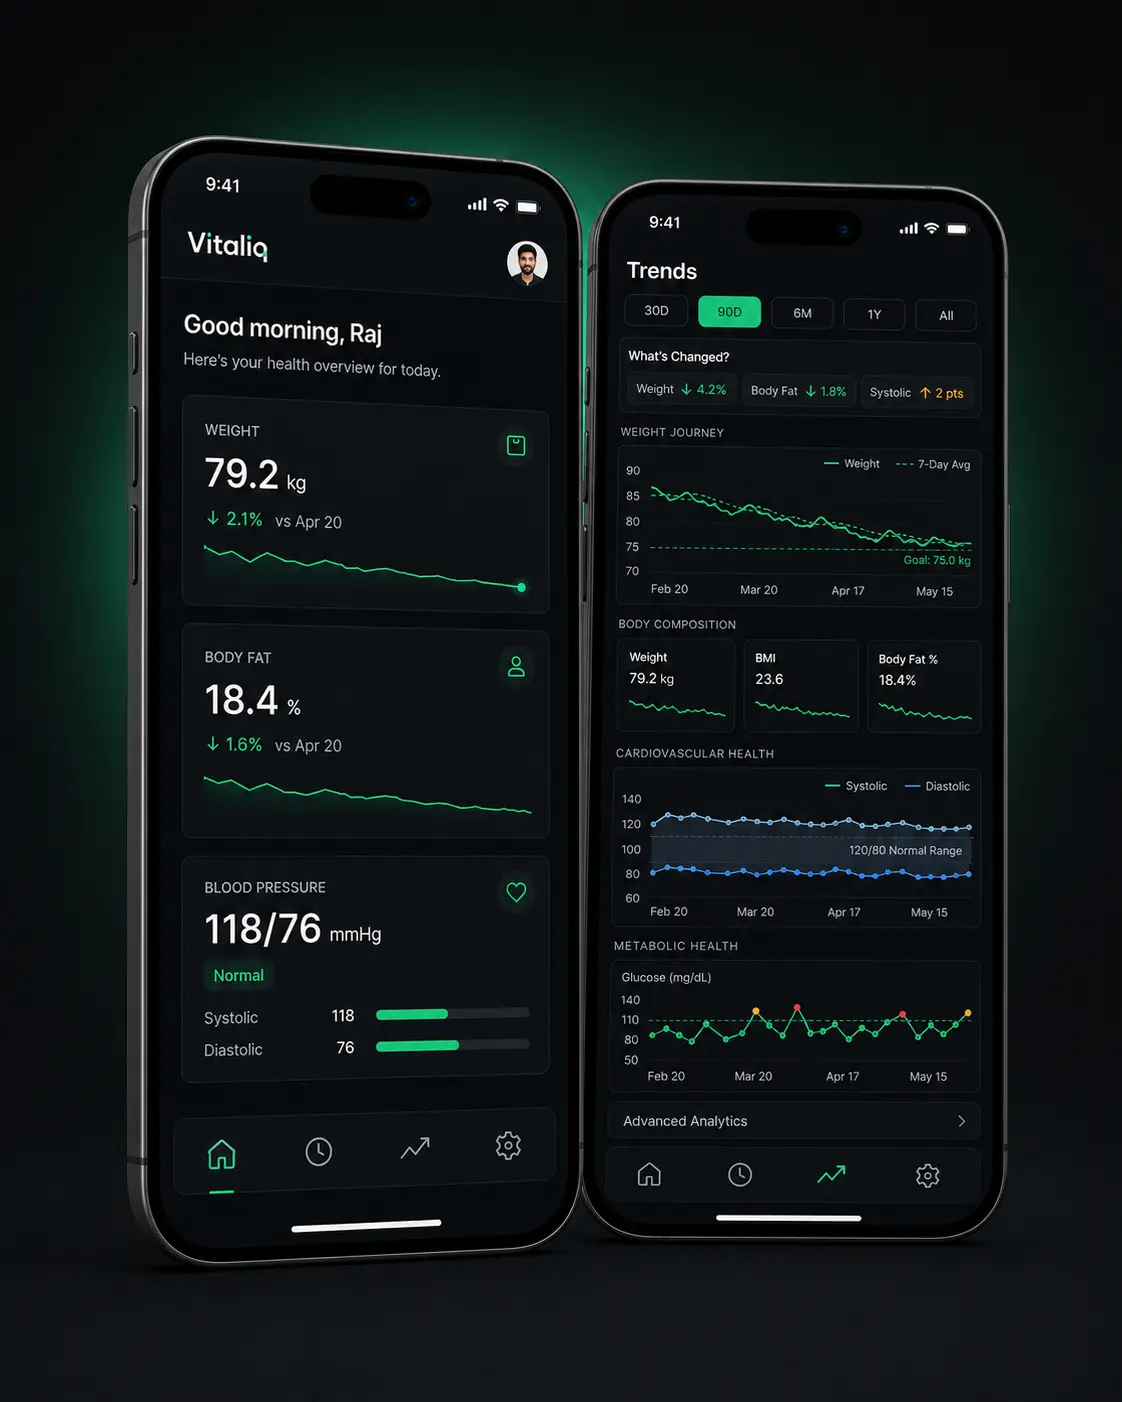 Mobile dashboard and Trends views, with a sticky account header and a bottom tab bar reserved for navigation.
User Journey
-
Arrival. A visitor lands on
/, which is public and serves the marketing page. If they're already signed in, middleware quietly redirects them to/dashboard— no separate/landingURL, no extra redirect hop. -
First look, no commitment. They click Try Demo and land inside a fully populated account with ten months of realistic history, without typing a password.
-
Sign up for real. If they want their own data, Clerk handles sign-up; on first authenticated request, an on-demand
syncUser()call provisions theirusersrow and default profile/goals/preferences — no webhook infrastructure required. -
Log a measurement. From the Dashboard or the dedicated
/logpage, they open the logging panel (desktop side panel, mobile drawer), pick a metric type, and submit — a Server Action validates with Zod, writes through the Domain/Repository stack, and revalidates the affected pages.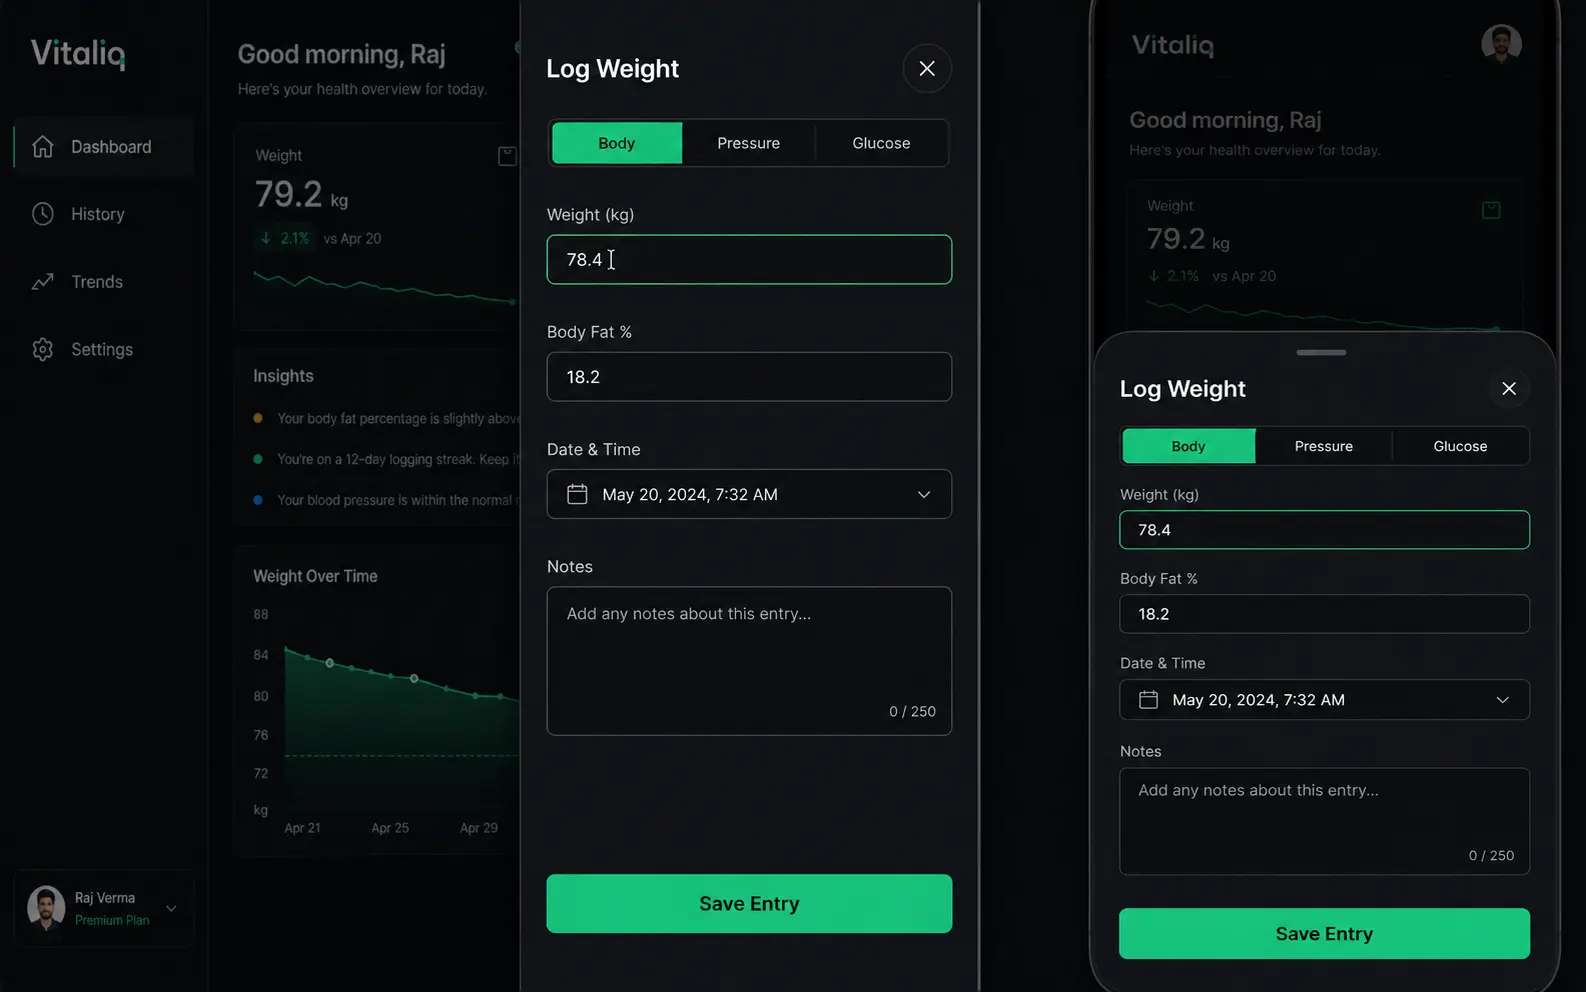 The same logging form adapts from a desktop side panel to a mobile slide-up drawer.
 -
Check the History. Every entry they've logged is searchable and paginated, color-coded by category, editable and deletable from the same list.
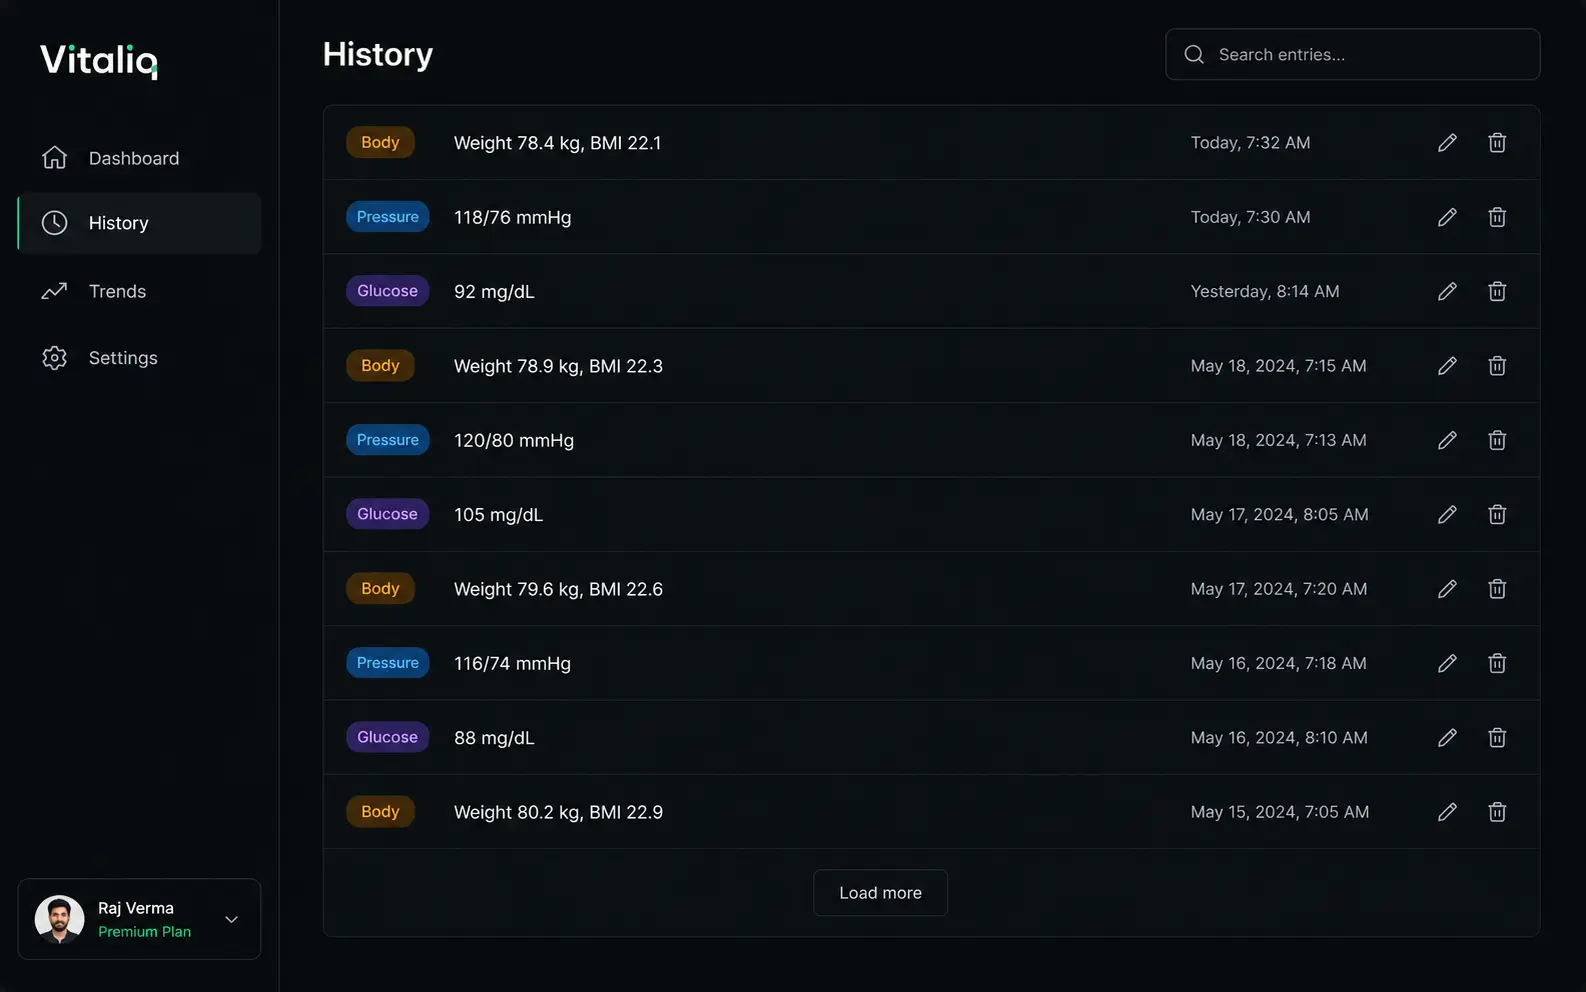 Every logged measurement in one searchable, cursor-paginated timeline.
 -
Set a goal. In Settings, they set a target weight, body-fat percentage, and target date; the Dashboard and Trends immediately start referencing that goal in progress bars and reference lines.
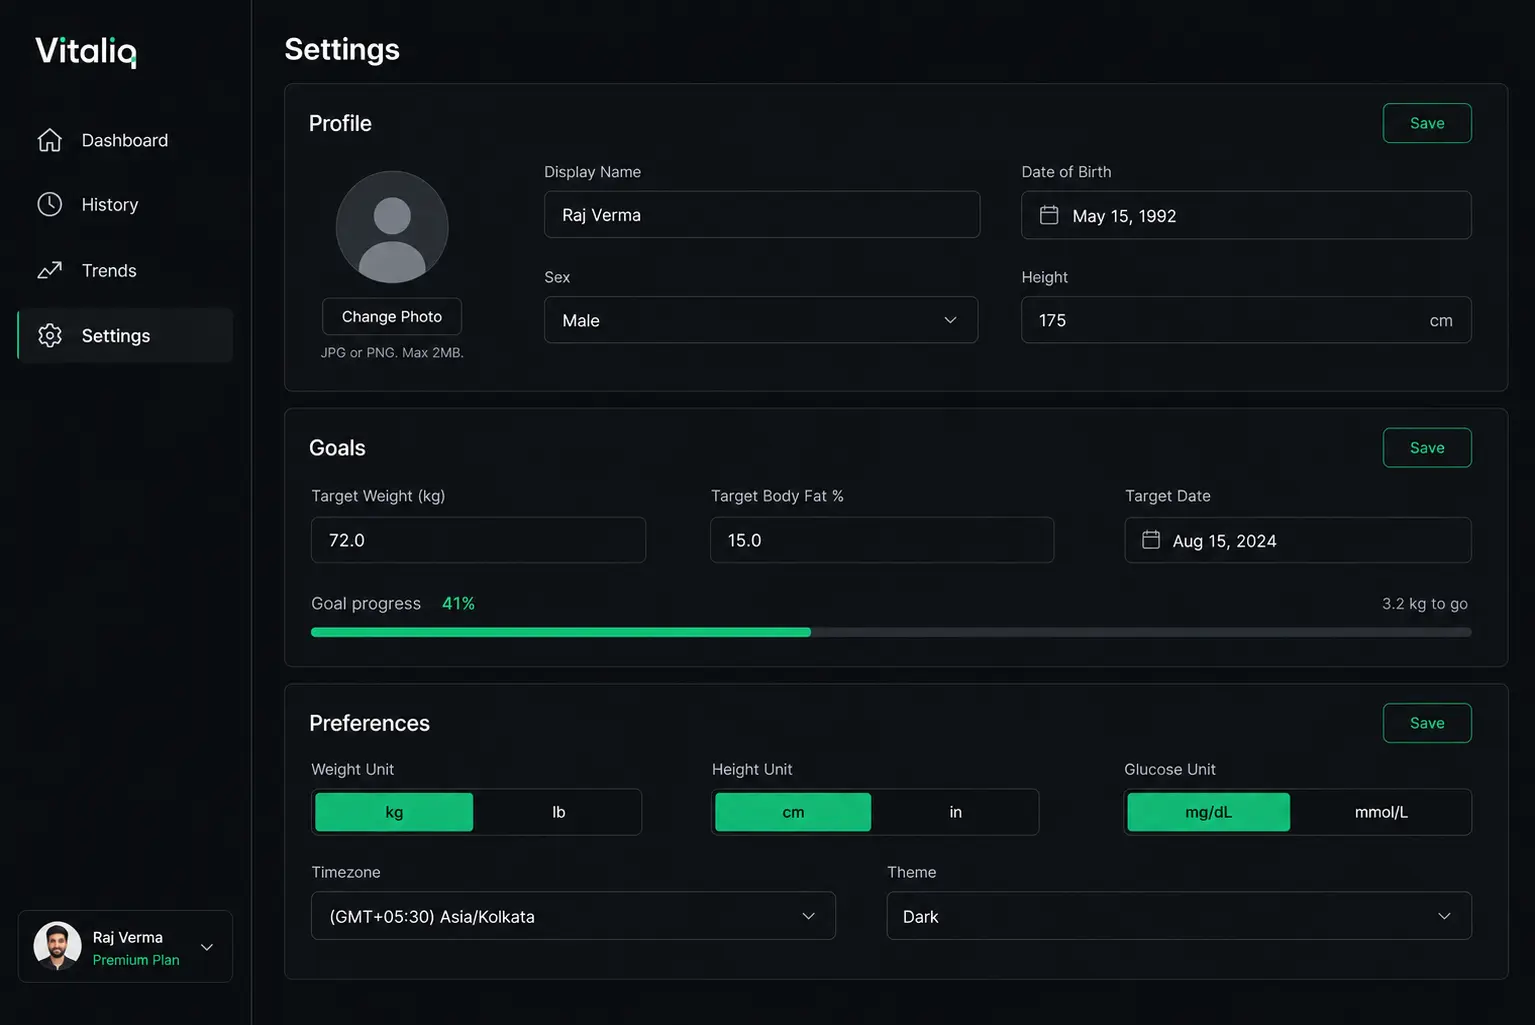 Profile, goals, and unit/timezone preferences in one page.
 -
Watch the story unfold. Over time, Trends shows moving averages, comparative-period deltas, and rule-based insights — a running narrative of the user's own health data, not a static export.
Technical Stack
Every choice here was made against a specific constraint, not by default:
- Next.js 15 (App Router) + React 19 + TypeScript — Server Components for data-heavy pages keep all statistical computation server-side ("zero client math"), so the client never duplicates trend or comparison logic already computed once on the server.
- Clerk — authentication was deliberately kept out of application code. On-demand user provisioning (sync on first authenticated request) was chosen over a Clerk webhook specifically to avoid webhook signature-verification infrastructure, at the cost of a small amount of added latency on a user's very first request.
- Neon PostgreSQL + Drizzle ORM — replaced an earlier Supabase implementation once Supabase's free-tier two-project limit was exhausted. Neon was chosen for a generous free tier and standard, vendor-neutral Postgres that fit the existing repository abstraction without a rewrite of its public API.
- Tailwind CSS + hand-rolled UI primitives — shadcn/ui was explicitly evaluated and rejected; the existing hand-built primitives were judged well-crafted and already matched the design language, and adopting shadcn would have imposed a different styling convention for no real gain.
- Recharts — covers roughly 80% of the charting needs out of the box, including native
syncIdcross-chart synchronization, which turned out to be sufficient without ever needing a lower-level library like VisX. - Zod — validation at the Server Action and repository boundary, and (later) for centralized environment-variable validation with safe placeholder fallbacks during static builds.
- Vitest + Playwright — Vitest covers the pure statistics/analytics/insights layer (the highest-value place for unit tests, since it's pure and deterministic); Playwright was added later for a real end-to-end journey test, running against a purpose-built mock-auth/mock-database layer so it needs no live credentials.
- GitHub Actions — three workflows: one for typecheck/lint/test/build on every PR, one dedicated to Drizzle schema-drift detection, and one that added Playwright to the standard validation pipeline.
System Architecture
The request-handling path is a strict, one-directional layering. UI code never talks to the database directly, Domains never contain raw query syntax, and Repositories are the only code allowed to import the Drizzle client.
flowchart TD
    UI["UI — Server & Client Components"]
    SA["Server Actions (writes)"]
    DOM["Domain Layer — business orchestration"]
    REPO["Repository Layer — persistence mapping + tenant isolation"]
    ORM["Drizzle ORM"]
    DB[("Neon PostgreSQL")]

    UI -- "reads" --> DOM
    UI -- "writes" --> SA
    SA --> DOM
    DOM --> REPO
    REPO --> ORM
    ORM --> DB
Analytics run through a completely separate, decoupled pipeline that has zero knowledge of React, Server Actions, Clerk, or the database — an explicit architectural rule enforced from the start:
flowchart LR
    A["Domain Records"] --> B["Statistics — pure functions\n(mean, trend, % change, BMI...)"]
    B --> C["Analytics Engine\n(extracts & aggregates time series)"]
    C --> D["Insights Engine\n(rule-based, explainable)"]
    D --> E["Dashboard / Trends\n(presentation only)"]
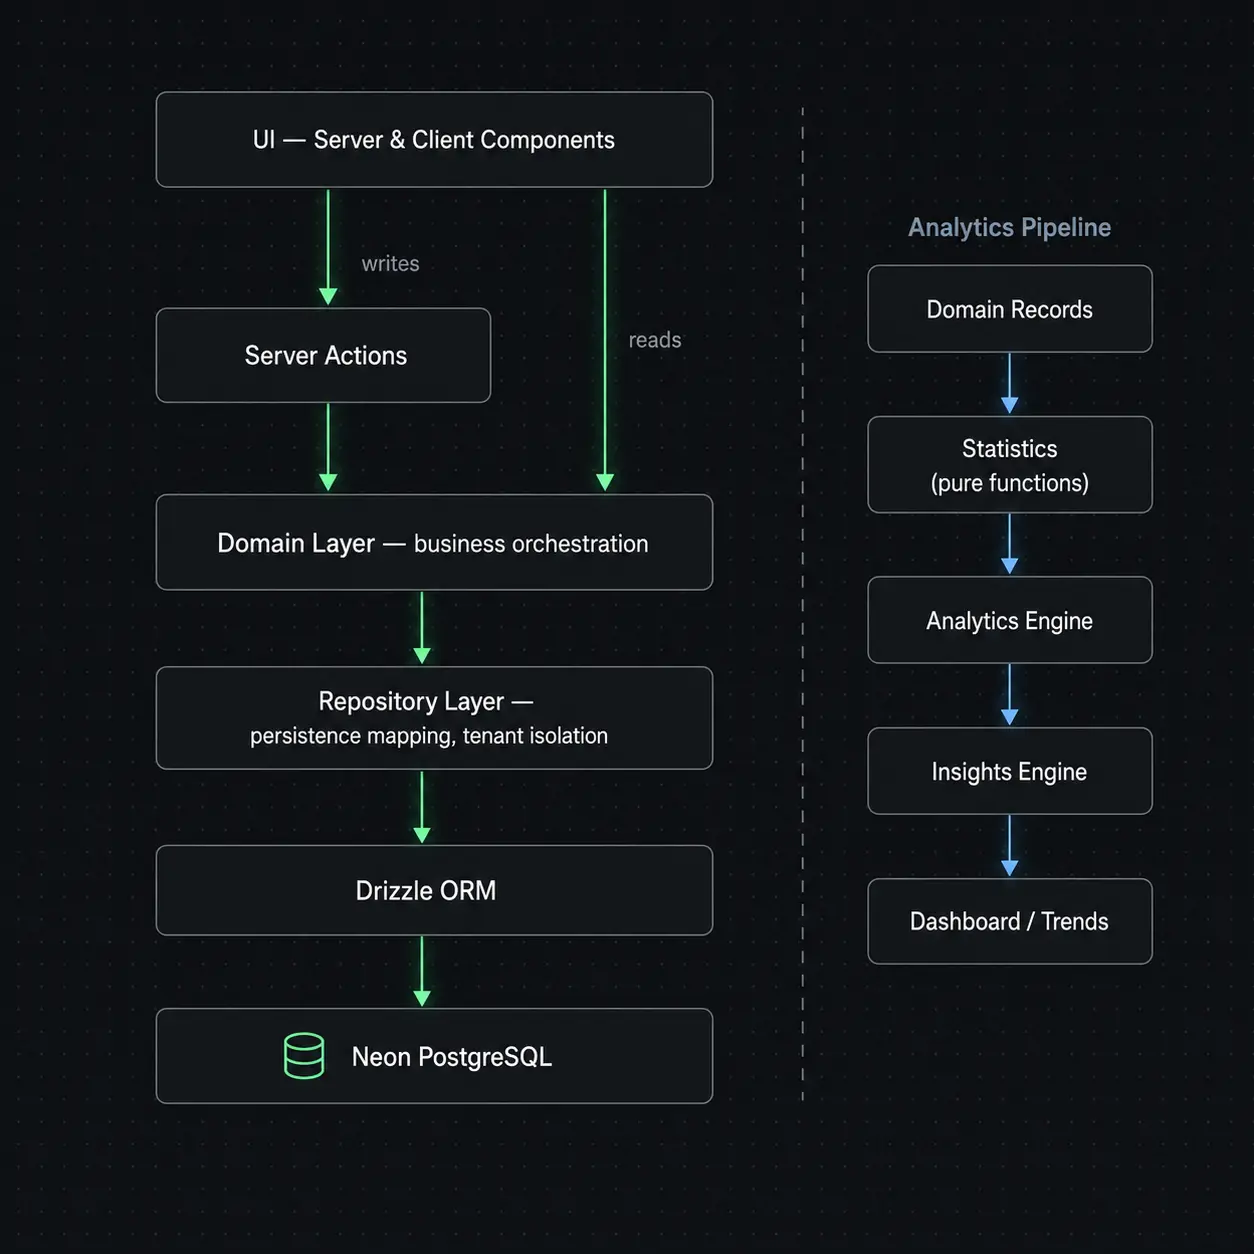 The full request-handling path alongside the decoupled analytics pipeline.
Repository layer. Every repository implements a shared BaseRepository<T, CreateInput, UpdateInput> contract with cursor-based pagination. This is also where tenant isolation lives: every select/insert/update/delete explicitly filters on the authenticated user's ID, since — after leaving Supabase — there's no database-level Row-Level-Security backstop anymore. Repositories also map raw Postgres rows (snake_case, NUMERIC columns returned as strings) into camelCase, correctly-typed domain objects, and compute presentational category values (BMI category, BP category, etc.) at read time.
Domain layer. HealthDomain orchestrates the three log repositories and exposes the only entry points pages are allowed to call — getMetricRecords(), getRecentWeightRecords(), and record-mutation orchestration. ProfileDomain handles the parallel-fetch case for Settings, pulling from four repositories at once. Domains were declared "frozen" during the entire Neon migration, which is exactly what made that migration safe.
Analytics pipeline. A pure statistics library (count, mean, median, moving average, sample standard deviation, percentage change guarded against divide-by-zero, trend direction with a noise-absorbing threshold, BMI and category classification) feeds an analytics engine that extracts and aggregates time series, which feeds a rule-based insights engine. Every insight is anchored to an optional reference date, which keeps the whole pipeline deterministic and testable — the same input always produces the same output, which matters both for unit tests and for the demo dataset.
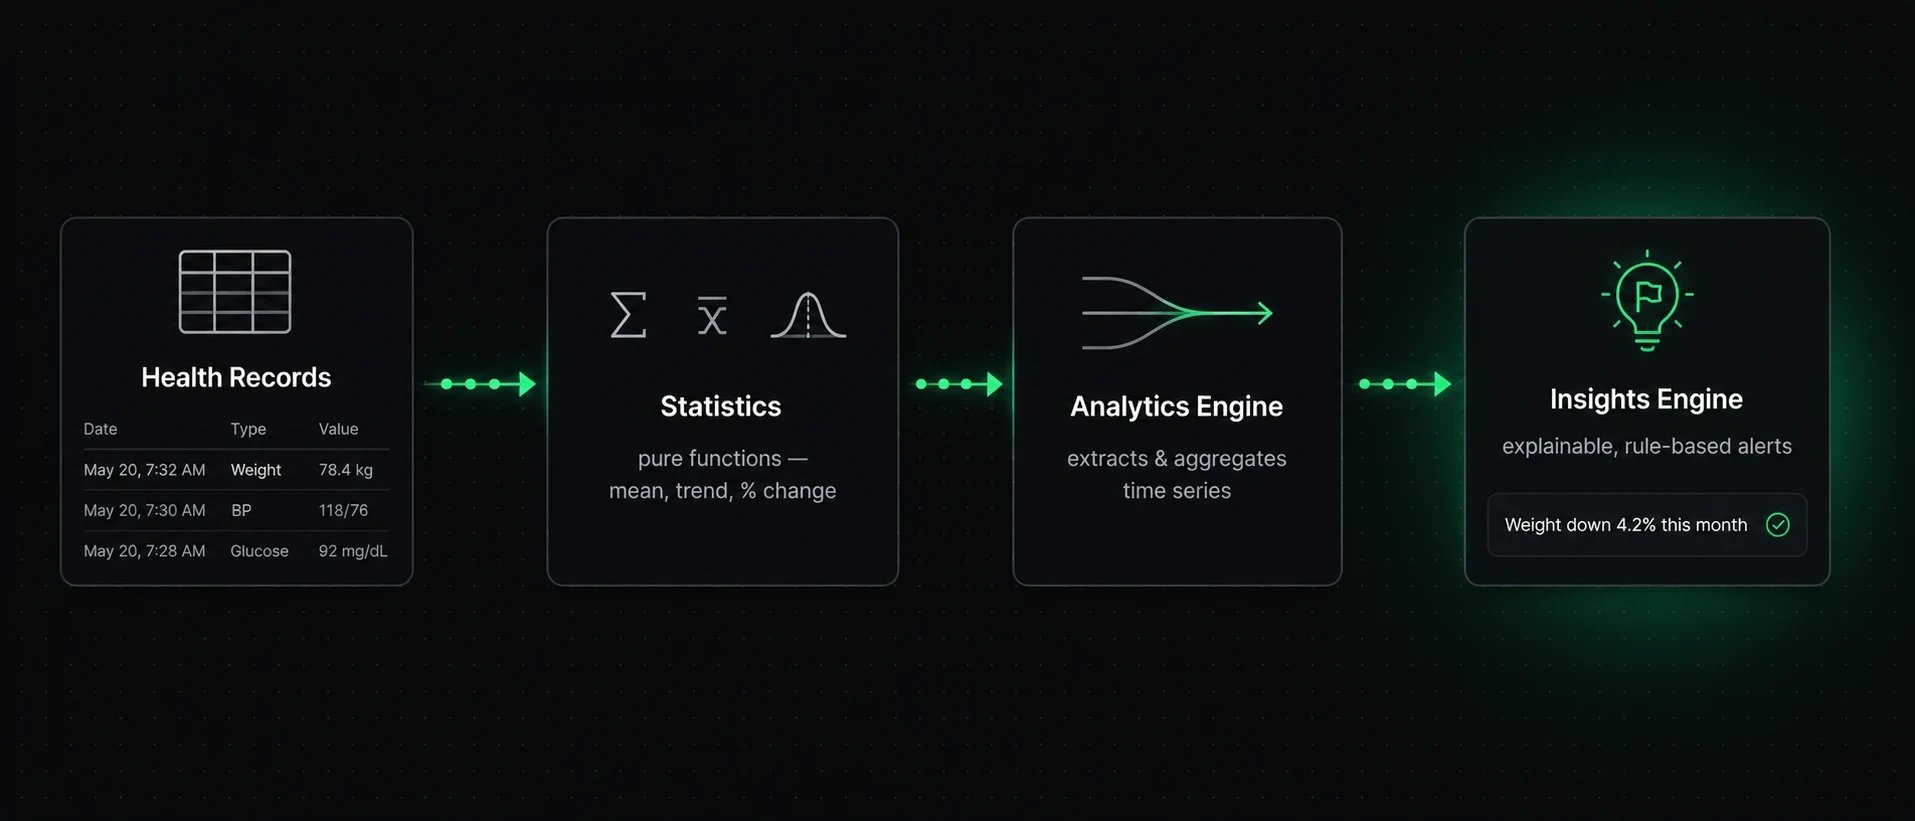 Raw records flow through pure statistics, an aggregation engine, and a rule-based insights engine — every output is traceable to a concrete rule.
Demo data subsystem. A separate, scenario-driven generator (core/demo/) produces the seeded persona dataset. It's deliberately built to respect the same repository boundary as everything else — it calls BodyRepository.bulkCreate(), PressureRepository.bulkCreate(), and GlucoseRepository.bulkCreate() rather than touching Drizzle or raw SQL directly, so it can never drift out of sync with how real user data is written.
Important Engineering Decisions
Clerk userId as the primary key, not a separate internal UUID. Using the Clerk user ID directly as users.id (TEXT PRIMARY KEY) eliminates ID-translation subqueries in every query and policy, at the cost of some coupling to Clerk's ID format if the auth provider ever changed. For a project this size, the simpler query surface won.
Repository/Domain/Server Action layering, imposed on top of an initially flatter design. An early "Server Action → Query" proposal was rejected in favor of this stricter layering specifically to keep business logic out of pages and to make persistence swappable. It added real boilerplate per feature — and then directly justified itself when the entire database was swapped out under it with zero Domain-layer changes.
Business rules and derived values live in application code, never in the database. BMI category, blood-pressure category, and even the measuredDate field were originally implemented as Postgres generated columns. That caused a real portability bug — timestamptz::date casts aren't IMMUTABLE, and Postgres rejected the expression the moment the schema was applied to a fresh database. The fix wasn't just patching the cast; every derived value was moved into repository mapper functions instead, on the explicit principle that business-rule thresholds should be able to evolve without a migration.
A dedicated mock-auth/mock-database layer for offline development and testing. Rather than relying on Clerk's own test-mode tooling against a real (if disposable) database, a webpack-alias-swapped mock Clerk client and an in-memory Drizzle-shaped proxy were built from scratch. This makes screenshot automation, local development, and the full Playwright suite work with zero live credentials — at the real cost of maintaining a second, parallel implementation of both auth and persistence that must never leak into production.
A single shared demo account, deliberately not sandboxed per visitor. Every "Try Demo" click signs the visitor into the same real Clerk user and the same underlying rows. Building per-visitor ephemeral sandboxes was considered and explicitly rejected as more engineering complexity than the use case justifies; the accepted mitigation is periodic reseeding of the shared dataset. This is a known, named tradeoff, not an oversight — see Limitations below.
Root path / as a single, smart-routed entry point. Rather than a separate public /landing route or moving the app to /overview, the root path serves the landing page to guests and redirects authenticated users to /dashboard — the standard SaaS pattern, chosen for a single shareable URL with no extra redirect hop. Getting this right took two iterations (see Challenges below).
Challenges
The Supabase → Neon migration. Supabase's free tier caps out at two projects, and a new production project was needed for this one. Rather than pay for Supabase or reuse an existing project, the migration moved to Neon + Drizzle ORM in three explicitly scoped phases: infrastructure first (schema translated 1:1, Supabase code left intact as a rollback path), then repositories migrated one at a time with a compile check after each, then cleanup. The payoff of the earlier Repository/Domain boundary showed up directly here — the migration required zero changes to the Domain layer or Server Actions.
A Postgres portability bug that only appeared on a fresh database. drizzle-kit push failed against a genuinely empty Neon database with error: generation expression is not immutable (Postgres error 42P17). The root cause was a generated column casting a timestamptz to date — timezone-dependent, and therefore not IMMUTABLE, which Supabase's incrementally-applied migration history had apparently never surfaced. The fix removed all six generated columns across the three log tables and relocated every derived calculation into repository mapper functions, closing the door on this entire class of bug rather than patching the one cast.
A real production routing bug, caught only by visiting the live URL. An early implementation of the smart-routed landing page redirected unauthenticated visitors to /landing — but /landing wasn't included in the public-route matcher, so Clerk's own middleware caught the request on a second pass and bounced everyone into the sign-in screen instead of the marketing page. Every earlier code-level walkthrough had described the routing as correct; the bug was only found by actually visiting the deployed app as a logged-out visitor. The fix collapsed the design to a single root route with no separate /landing path at all.
Losing Postgres Row-Level Security as a backstop. Neon, as used here, has no RLS equivalent in place. Tenant isolation used to be enforced two ways under Supabase — RLS and application-layer filtering; after the migration it rests entirely on every repository query explicitly filtering by user ID, verified by code review rather than a database guarantee. This is treated as an ongoing discipline requirement, not a solved problem.
Performance Considerations
- "Zero client math." All comparative statistics — trend direction, moving averages, period-over-period deltas — are computed once on the server and passed to the client as pre-formatted display strings, avoiding duplicated calculation logic and keeping client bundles lighter.
- Dynamic imports for chart-heavy widgets. The line-chart and blood-pressure widgets are loaded with
next/dynamic({ ssr: false }), which reportedly cut the Trends page's first-load JavaScript from roughly 224kB to 114kB. - In-memory merge, not yet a database view.
HealthDomain.getTimeline()currently merges and sorts records from multiple repositories in application memory. That's fine at the current table count, and is explicitly flagged as a candidate to become a materialized database view once more metric types are added. - Unbounded "All-time" queries remain a known limit. Standard date-range queries (30/90 days, etc.) are efficient; selecting "All" currently fetches full history client-side with no downsampling yet — flagged as a future risk for long-tenured, highly active users rather than something already causing problems.
Accessibility
- Editing surfaces use
role="dialog"/aria-modal="true", with focus trapping and focus restoration to the triggering element on close. - Icon-only buttons (edit, delete) carry explicit
aria-labels. - Toast notifications use
role="status"/role="alert"so they're announced without stealing focus. - Loading states use skeleton components that mirror each page's real grid layout, minimizing layout shift rather than showing a generic spinner.
- A self-audit scored accessibility 6/10 at one point — lower than the other measured categories — and is called out here rather than smoothed over; it's an area with clear, identified room to improve, not a finished checklist.
Security
- Authentication is entirely delegated to Clerk. Middleware protects every route except sign-in, sign-up, and the webhook path.
- Authorization is application-layer only. Every repository method requires and applies an authenticated user-ID filter on every query — the single most important property to keep verifying by code review, since Neon (as configured here) has no Row-Level-Security backstop.
- The demo login never exposes credentials. It uses Clerk's Sign-In Tokens API to mint a short-lived (60-second), single-use token for a server-side-hardcoded demo user ID — the ID is never client-controllable, which is the specific property that prevents the endpoint from being usable to sign in as anyone else.
- A mock-auth/mock-database layer exists purely for development and testing (
MOCK_AUTH=true), gated behind a webpack alias and an environment flag. It must never be active in production; no explicit build-time safeguard against that currently exists, which is called out below as a real gap rather than assumed away. - A known, accepted data-integrity risk: the shared demo account means concurrent visitors can overwrite each other's demo data. This was weighed deliberately against building per-visitor sandboxing and accepted as a reasonable tradeoff for a portfolio-scale project, mitigated (in principle) by periodic reseeding.
Lessons Learned
- A clean Repository/Domain boundary pays for itself immediately, not just eventually. The Supabase → Neon migration was completed with zero changes to the Domain layer — the direct payoff of an earlier decision to reject a flatter, simpler-looking design.
- Keep business rules and derived values out of the database. What felt like a convenient shortcut (Postgres generated columns mirroring old spreadsheet formulas) caused a hard portability failure the moment the schema had to run against a genuinely fresh database, and it duplicated logic a pure statistics library already provided.
timestamptzcasts inside generated columns are a real, invisible-until-triggered portability trap — a class of bug that specifically won't show up until you apply a schema to an empty database rather than an incrementally-migrated one.- Losing a database-level security backstop requires a deliberate, ongoing discipline shift, not a one-time fix. Every new repository method is now a manual review item, not a database guarantee.
- Real production testing surfaces bugs that "should work" reviews miss. The routing bug was only caught by actually visiting the live deployment as a logged-out visitor — every earlier self-reported review of the routing logic had described it as correct.
- Deliberately choosing not to solve a hard problem is sometimes the right call. The shared demo account is a good example of naming a real risk, weighing the engineering cost of a "proper" fix against the actual value for the project's actual audience, and consciously accepting a lighter mitigation instead — and writing that reasoning down.
- Schema and migration drift belongs in CI, not discovered after a failed deploy. A schema-drift check was added specifically because it would have caught the generated-column bug earlier — a lesson applied immediately after learning it, not just noted for later.
Limitations
In the interest of being straightforward about where this stands rather than presenting it as more finished than it is:
- The demo account is a single shared Clerk user; concurrent visitors can overwrite each other's view of the demo data. A periodic reseed job was recommended as mitigation but is not confirmed as scheduled anywhere.
- Timeline/narrative events in the demo generator (e.g., "vacation," "started strength training") are currently attached to whichever measurement record happens to exist on that day, rather than stored as an independent, first-class record — a redesign was requested but not confirmed as implemented.
- The final production verification pass (full build/test/E2E run plus a manual spot-check of the routing fix) was drafted but its execution is not confirmed — this should be re-run and confirmed before treating the live deployment as fully verified.
- No automated tenant-isolation audit has been run against the repository layer; correctness currently depends on manual code review.
- No end-to-end tests exist yet for some interactive chart behaviors (hover sync, brush dragging), and overall test coverage is tracked only as an assertion count (28 Vitest assertions across 5 files, plus one Playwright journey test), not a coverage percentage.
Future Roadmap
- Multi-user authentication and identity (Clerk)
- Repository / Domain / Server Action layered architecture
- Body composition, blood pressure, and blood glucose tracking
- Pure statistics library + analytics engine + rule-based insights engine
- Health-domain-grouped Trends dashboard with global range selector
- Persistence migration from Supabase to Neon + Drizzle ORM
- Deterministic, story-driven demo account generator
- Responsive mobile UX (bottom nav, sticky account header, drawer editing)
- Error boundaries, centralized env validation, SEO metadata
- Playwright end-to-end test suite
- Deployed to Vercel
- Confirm and finalize the production routing fix (verify, run full CI, push)
- Automated tenant-isolation audit across every repository query
- Demo-data reseed job to mitigate shared-account concurrency
- First-class timeline/narrative events in the demo data model
- Lighthouse audit (Performance / Accessibility / Best Practices / SEO)
- Custom domain
- Error monitoring (e.g. Sentry) and privacy-conscious analytics
- Additional health metrics as new vertical slices (sleep, heart rate, steps)
- Wearable/health-platform integrations (Apple Health, Fitbit, Garmin, Dexcom, Oura)
- Materialized analytics snapshots for dashboard performance at scale
Results
Vitaliq doesn't have production usage metrics yet — it hasn't opened to real users beyond the developer and portfolio reviewers. What's measurable so far:
- 28 Vitest assertions across 5 test files covering the statistics, engine, insights, and category-classification logic, plus one full Playwright end-to-end journey test (landing → demo login → dashboard → navigation across Trends/History/Settings), passing in roughly 16 seconds headless.
- Trends page first-load JavaScript reduced from approximately 224kB to 114kB — roughly a 50% reduction — after switching chart widgets to dynamic, non-SSR imports.
- A full, working persistence-layer migration (Supabase → Neon + Drizzle) completed with zero reported changes to the Domain layer or Server Actions, directly validating the architectural bet made at the start of the project.
- Three GitHub Actions workflows enforcing typecheck/lint/test/build on every PR, plus a dedicated schema-drift check that would have caught the generated-column portability bug before it ever reached a real deployment.
Qualitatively, the project demonstrates a full, honest engineering loop: a real architectural decision, a real migration that tested it, a real production bug caught in the wild and root-caused from actual code rather than assumed away, and a documented, deliberate tradeoff (the shared demo account) rather than a silently-accepted shortcut.
Code Examples
The following snippets illustrate patterns established in the codebase — the shared repository contract, the domain-layer routing pattern, and the kind of pure statistics function the analytics pipeline depends on.
Shared repository contract, implemented by every repository (BodyRepository, PressureRepository, GlucoseRepository, etc.), giving each one a consistent CRUD and pagination shape:
interface QueryFilters {
  userId: string;
  cursor?: string;
  limit?: number;
}

interface BaseRepository<T, CreateInput, UpdateInput> {
  findById(id: string, userId: string): Promise<T | null>;
  findMany(filters: QueryFilters): Promise<{ items: T[]; nextCursor?: string }>;
  create(userId: string, input: CreateInput): Promise<T>;
  update(id: string, userId: string, input: UpdateInput): Promise<T>;
  delete(id: string, userId: string): Promise<void>;
}
Domain-layer metric routing — pages never import a repository directly; they go through HealthDomain, which selects the correct repository by metric kind:
type MetricKind = "body" | "pressure" | "glucose";

class HealthDomain {
  async getMetricRecords(userId: string, kind: MetricKind, from?: Date) {
    const repository = this.repositoryFor(kind);
    return repository.findMany({ userId, from });
  }

  private repositoryFor(kind: MetricKind) {
    switch (kind) {
      case "body":
        return this.bodyRepository;
      case "pressure":
        return this.pressureRepository;
      case "glucose":
        return this.glucoseRepository;
    }
  }
}
A pure statistics function — no database access, no React, no system clock reads, matching the architectural rule enforced across the entire analytics layer:
function percentageChange(from: number, to: number): number | undefined {
  if (from === 0) return undefined; // guarded, never NaN or Infinity
  return ((to - from) / from) * 100;
}

function trendDirection(
  values: number[],
  noiseThreshold = 0.5,
): "up" | "down" | "flat" {
  const change = percentageChange(values[0], values[values.length - 1]) ?? 0;
  if (Math.abs(change) < noiseThreshold) return "flat";
  return change > 0 ? "up" : "down";
}
Technology Table
| Technology | Responsibility |
|---|---|
| Next.js 15 (App Router) | Routing, Server Components, Server Actions, rendering |
| React 19 | UI runtime |
| TypeScript | End-to-end type safety across UI, domain, and repository layers |
| Tailwind CSS | Styling, using a small set of reused design tokens |
| Clerk | Authentication, session management, demo sign-in tokens |
| Neon PostgreSQL | Primary relational datastore |
| Drizzle ORM | Type-safe query building and schema/migration tooling |
| Recharts | Charting (line charts, composed charts, cross-chart sync via syncId) |
| Zod | Runtime validation for Server Actions, repositories, and environment variables |
| Vitest | Unit testing for the statistics/analytics/insights layers |
| Playwright | End-to-end journey testing against a mock-auth/mock-database layer |
| GitHub Actions | CI — typecheck, lint, test, build, schema-drift detection |
| Vercel | Hosting and deployment |
Images
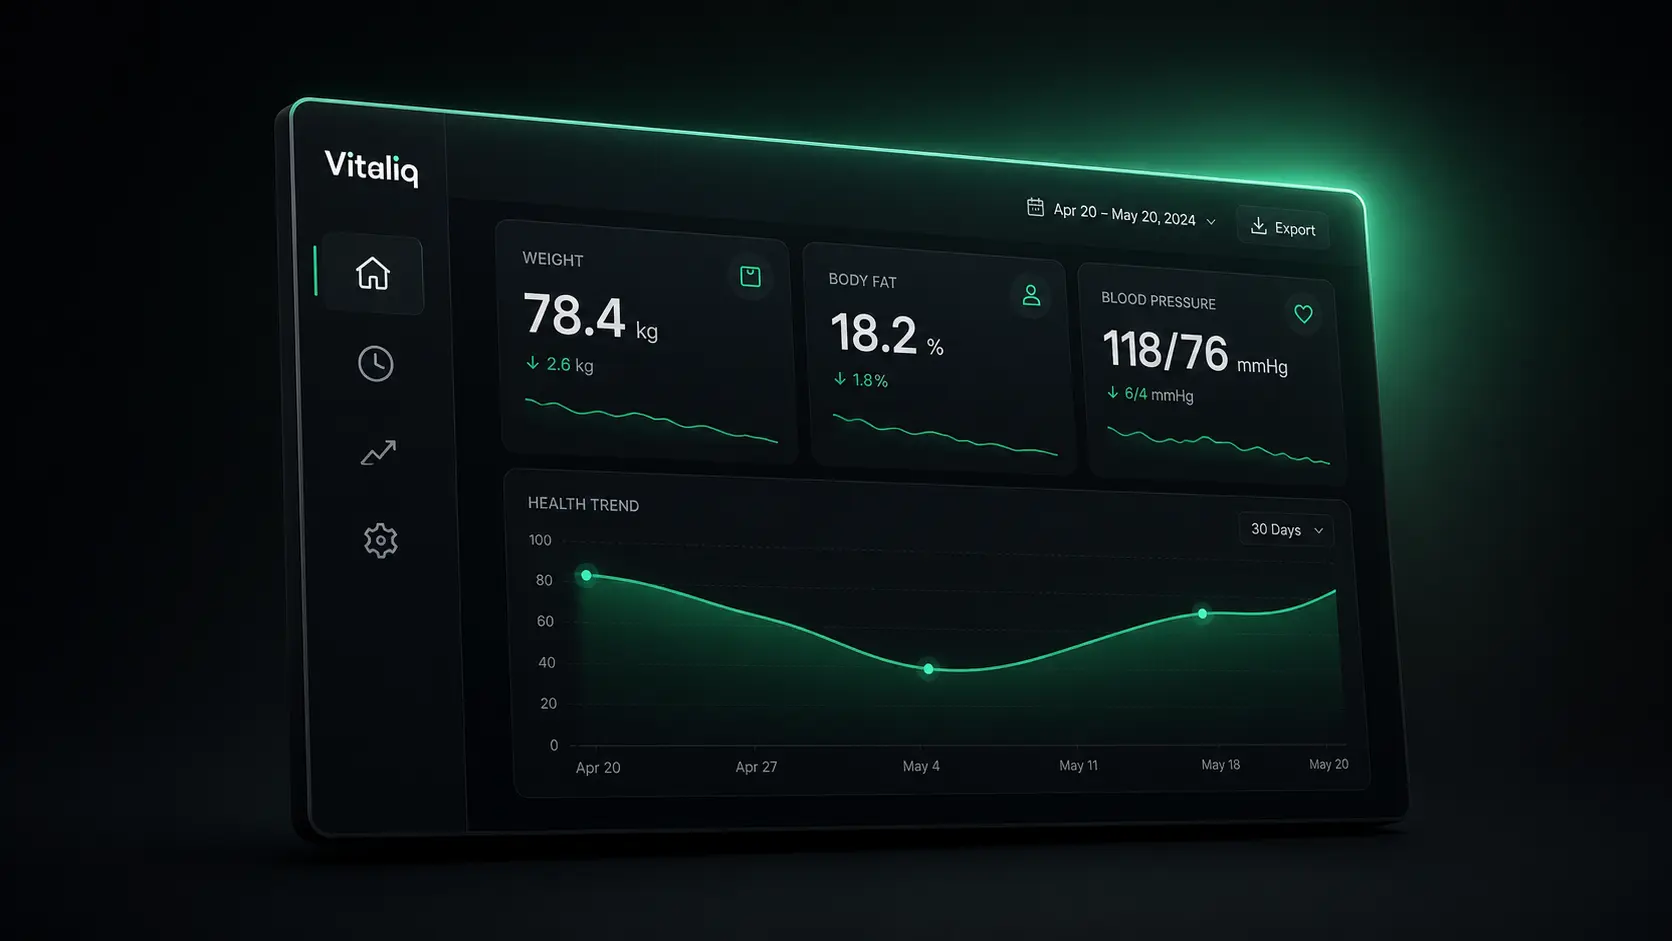 Cover image.
The public landing page.
The Dashboard — stat cards, ranked insights, and a primary trend chart.
The health-domain-grouped Trends dashboard.
Paired systolic/diastolic visualization with a shaded normal-range band.
Responsive mobile dashboard and Trends views.
Searchable, paginated history of logged measurements.
Desktop side panel vs. mobile slide-up drawer for logging a measurement.
Profile, goals, and preferences.
System architecture: request flow and the parallel analytics pipeline.
From raw records to explainable insights.