Multidimensional Empirical Evaluation of India's Infrastructure Systems
An empirical evaluation of India's infrastructure systems across logistics, urban form, housing, water, energy, digital networks, and governance.
Show case file details
Method
Empirical Evaluation
Length
15 minutes.Source Material
- Source 1: highlights: economic survey 2025-26 - PIB
- Source 2: Economic Survey 2025-26 - PIB
- Source 3: India Forward: Emerging Perspectives - S&P Global
- Source 4: Economic Survey 2025-26 Highlights - Union Budget
- Source 5: Strengthening the macroeconomic foundations for growth: OECD Economic Surveys: Viet Nam 2025
- Source 6: summary of economic survey 2024-25 - PIB
- Source 7: ASEAN Investment Report 2025 - Foreign Direct Investment and Supply Chain Development
- Source 8: Southeast Asia quarterly economic review: Q3 2025 - McKinsey
- Source 9: Gati Se Pragati 2025 Report | Grant Thornton Bharat
- Source 10: Financing India's urban infrastructure needs - World Bank Document
- Source 11: Impact of Land Use Regulations: Evidence from India's Cities - ResearchGate
- Source 12: From Growth Engine to Global Edge: Supercharging India's Logistics - PIB
- Source 13: India joins the advanced economies with reassessed 7.97% logistics cost to GDP - ET Infra
- Source 14: Assessment of Logistics Cost in India
- Source 15: India Marks Three Years of National Logistics Policy: Transforming India's Supply Chain Ecosystem - PIB
- Source 16: India's Ranking in Different Indexes 2025 List - theIAShub
- Source 17: Logistics key for India as a business destination - World Bank
- Source 18: 2023 | Logistics Performance Index (LPI) - World Bank
- Source 19: Connecting to compete 2023 - Logistics Performance Index - World Bank
- Source 20: International Scorecard Page | Logistics Performance Index (LPI) - World Bank
- Source 21: International Scorecard Page | Logistics Performance Index (LPI) - World Bank
- Source 22: International Scorecard Page | Logistics Performance Index (LPI) - World Bank
- Source 23: world bank ranks india among the top five countries in terms of private investment in infrastructure among low- and middle-income economies - PIB
- Source 24: Publication: Highway to Success: The Impact of the Golden Quadrilateral Project for the Location and Performance of Indian Manufacturing - Harvard DASH
- Source 25: Infrastructure and Finance: Evidence from India's GQ Highway Network - NBER
- Source 26: Competition and the welfare gains from transportation infrastructure ...
- Source 27: Highway to Success: The Impact of the Golden Quadrilateral Project for the Location and Performance of Indian Manufacturing - Harvard Business School
- Source 28: Spatial Data Infrastructure for Sustainable Development: Evaluating PM Gati Shakti as India's Geospatial Framework
- Source 29: PM GatiShakti Network Planning Group Evaluates 352 Infrastructure Projects Worth ₹16.10 Lakh Crore - PIB
- Source 30: PM Gati Shakti: India's Next-Generation Infrastructure Blueprint - Makaan Expert
- Source 31: Addressing Legal and Regulatory Barriers to Quality Infrastructure Investment in India, Indonesia and the Philippines | OECD
- Source 32: TWO YEARS OF PM GATI SHAKTI: PERFOMANCE APPRAISAL AND WAY AHEAD - IJCRT.org
- Source 33: Commentary: Significance and Implications of National Logistics Policy of India
- Source 34: Impact of urban density on human well-being and sustainable ...
- Source 35: Evaluating urban development and socio-economic disparity in India through nighttime light data
- Source 36: Cities in Bad Shape: Urban Geometry in India - American Economic Association
- Source 37: Cities in Bad Shape: Urban Geometry in India∗ - Department of Economics
- Source 38: Cities in Bad Shape: Urban Geometry in India∗ - Marron Institute
- Source 39: Cities in Bad Shape: Urban Geometry in India - Jan Stuhler
- Source 40: A Review of Spatial Mismatch Research: Empirical Debate, Theoretical Evolution and Connotation Expansion - MDPI
- Source 41: Cities in Bad Shape: Urban Geometry in India - Wharton Faculty Platform
- Source 42: Developing the Urban Diversity Index (UDI): A Global Comparison of Urban Qualitative Aspect and Its Implications for Sustainable Urban Planning Using POI Data - MDPI
- Source 43: Unlocking Cities - Boston Consulting Group
- Source 44: The Uber BCG Study: Need for ridesharing in India more NOW than EVER
- Source 45: MOVING FORWARD TOGETHER - NITI Aayog
- Source 46: Economic Survey 2025-26 suggests congestion pricing for dense business districts
- Source 47: Relaxing Floor Area Ratio: Housing Supply & Affordability in India - Geetika Nagpal
- Source 48: Beyond Rules: Market Logic, Institutional Lag, and the Limits of Floor Space Index Deregulation in Hyderabad - MDPI
- Source 49: Urban India's housing supply response to migration-induced demand - Ideas for India
- Source 50: Affordable Skylines: Unpacking the Impact of Zoning Relaxation in India. Guest post by Geetika Nagpal. - World Bank Blogs
- Source 51: Assessing The Impact Of Floor Space Index (FSI) Regulations On Urban Density And Infrastructure Development In Hyderabad - IJCRT.org
- Source 52: WORKING PAPER NO: 464 Analysing Urban Growth Boundary Effects in the City of Bengaluru - IIM Bangalore
- Source 53: Bengaluru's Real Estate Crisis: A Housing Affordability Challenge - Aurum PropTech
- Source 54: Housing Demand and Affordability in India - World Bank Document
- Source 55: Housing Demand and Affordability in India : Implications for Housing Policy - IDEAS/RePEc
- Source 56: Peri-Urban Real Estate, Land-Use Changes, and Sustainability Challenges in Bangalore: Lessons from the Global South - MDPI
- Source 57: Affordable Housing in India - Knight Frank
- Source 58: Demand for Grants 2024-25 Analysis : Jal Shakti - PRS India
- Source 59: Water, Sanitation and Hygiene | UNICEF India
- Source 60: Annual Report 2024-25 - Department of Drinking Water and Sanitation
- Source 61: Cabinet approves the continuation of Swachh Bharat Mission (Urban) [SBM U] till 2025-26 for sustainable outcomes - PM India
- Source 62: Annual Report 2023-24 - Department of Drinking Water and Sanitation
- Source 63: Estimating health gains from increased access to safely managed drinking- water services following Government of India's Jal Jeevan Mission Study
- Source 64: Water Works: The Economic Impact of Water Infrastructure*
- Source 65: Impact of infrastructure on output, productivity and efficiency: Evidence from the Indian manufacturing industry - Emerald Publishing
- Source 66: Site Amenities and Workers' Welfare Factors Affecting Workforce Productivity in Indian Construction Projects - ASCE Library
- Source 67: How Do Electricity Shortages Affect Industry? Evidence from India † - ResearchGate
- Source 68: How Do Electricity Shortages Affect Industry? Evidence from India
- Source 69: NBER WORKING PAPER SERIES HOW DO ELECTRICITY SHORTAGES AFFECT PRODUCTIVITY? EVIDENCE FROM INDIA Hunt Allcott Allan Collard-Wexle
- Source 70: INDIANA UTILITY REGULATORY COMMISSION ELECTRIC UTILITY RELIABILITY REPORT 2024 - IN.gov
- Source 71: September 2025 - The Leap Blog
- Source 72: September 2025 (AEML) - Adani Energy Solutions
- Source 73: Energy Productivity and Energy Demand: Experimental Evidence from Indian Manufacturing Plants - NBER
- Source 74: Crisil Infrastructure Yearbook 2025
- Source 75: Single-Window System for PPA Clearance Key to Renewables Growth: Interview
- Source 76: Digital India: Technology to transform a connected nation | McKinsey
- Source 77: Satellite Internet in India - PIB
- Source 78: Telecom Regulatory Authority of India The Indian Telecom Services Yearly Performance Indicators 2024-2025
- Source 79: 7th February, 2025 Shri Amit Sharma, Advisor (Financial & Economic Analysis), Telecom Regulatory Authority of India - TRAI
- Source 80: Universal connectivity and Digital India initiatives reaching to all areas, including tier-2/3 cities and villages - PIB
- Source 81: The impact of digital public infrastructure on financial inclusion and economic growth in rural India: evidence from the UPI revolution - Emerald Publishing
- Source 82: Digital Transformation and Economic Growth in India: An Empirical Study - IJPS
- Source 83: The Impact of Digital Financial Infrastructure on Economic Growth: Evidence from India
- Source 84: The Digital Blueprint for Ease of Doing Business - PIB
- Source 85: Key Highlights from Economic Survey 2025-26 for Infrastructure sectors
- Source 86: Public Private Partnership's Growth Empirics in India's ... - ISEC
- Source 87: Comprehensive Mobility Planning in Indian Cities: Challenges, Gaps, and the Way Forward
- Source 88: Collaboration Riskscape: Fragmentation, Problem Types and Preference Divergence in Urban Sustainability | Publius: The Journal of Federalism | Oxford Academic
- Source 89: View of Bridging Policy and Practice: Evaluating Urban Governance and Implementation Gaps in India's Smart City Mission - A Case Study of Delhi - Ignited Minds Journals
- Source 90: REFORMS IN URBAN PLANNING CAPACITY IN INDIA - NITI Aayog
- Source 91: Urban Adaptation in India: Strategies, Challenges, and Case Studies for Resilient Cities - IJFMR
- Source 92: Values-Based Control in Land Acquisition for Infrastructure Projects - IDEAS/RePEc
- Source 93: Akancsha Title - Land Acquisition issues in infrastructure projects Host Organization
- Source 94: Land Acquisition and Corporate Investment in India– Impact of the Historical Land Ceiling Legislations* - American Economic Association
- Source 95: RURAL LAND TITLING AND REGULARIZATION PROJECTS Office of Evaluation and Oversight, OVE - IADB Publications
- Source 96: Semiconductor Industry in India: Incentives and Key Players - India Briefing
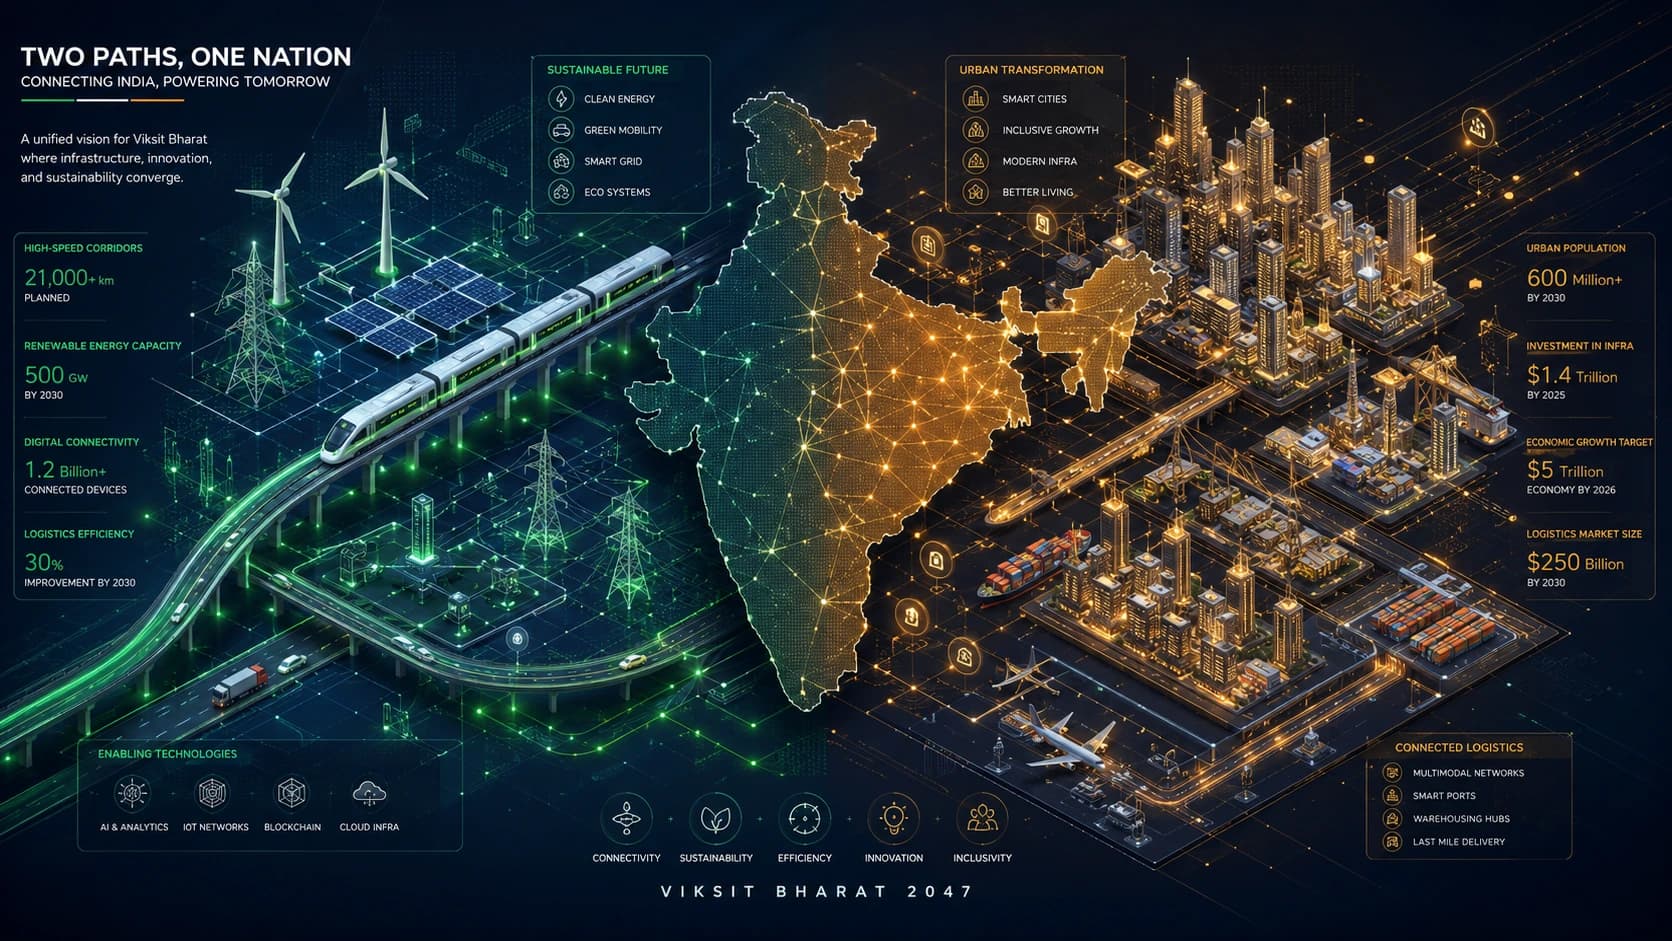
Introduction: The Macroeconomic Imperative and Global Benchmarking
India is currently navigating a profound structural and demographic transformation, underpinned by an aggressive pivot toward infrastructure-led economic development. As the national economy expands at an estimated real Gross Domestic Product (GDP) growth rate of 7.4 percent for the fiscal year 2025–2026 (FY26), the imperative to sustain this momentum relies almost entirely on the continuous modernization of the nation's physical and digital capital.1 With projections indicating that India's nominal GDP could reach over USD 7 trillion by FY31, thereby elevating its share of global GDP to 4.5 percent, the overarching macroeconomic strategy heavily favors capital expenditure (capex) as the primary growth multiplier.3 Consequently, the central government’s effective capex has scaled up to 4.0 percent of GDP in FY25, a stark increase compared to a pre-pandemic average of 2.7 percent, demonstrating a resolute fiscal commitment to overcoming historic infrastructure deficits.4
However, macro-level allocations alone are insufficient to guarantee systemic efficiency or global competitiveness. The contemporary global trade environment, characterized by shifting supply chains and the "China-Plus-One" diversification strategy, requires infrastructure systems to operate at peak efficiency. When benchmarked against global peers, India's trajectory is highly dynamic but reveals areas requiring sustained intervention. For instance, while foreign direct investment (FDI) inflows into India increased to USD 55.6 billion in the first eight months of FY25, competing nations like Vietnam have captured FDI inflows amounting to 4.8 percent of their GDP between 2015 and 2023, representing a higher relative share than India and other ASEAN economies.5 Vietnam's success in capturing these flows is heavily predicated on its aggressive infrastructure deployment and integration into global electrical and apparel supply chains.5
Nevertheless, India exhibits remarkable financial depth and structural stability that provides a foundation for massive infrastructure absorption. The BSE stock market capitalization to GDP ratio reached 136 percent at the end of December 2024, far exceeding comparative ratios in China (65 percent) and Brazil (37 percent).6 This financial capitalization provides a critical reservoir of private capital necessary to fund long-term infrastructure assets. Furthermore, the Incremental Capital Output Ratio (ICOR) has dropped to 3.9 in recent years, signaling that infrastructure investments are generating economic output much more efficiently than in previous decades.9
| Macroeconomic & Infrastructure Benchmarks | India | China | Vietnam | Brazil |
|---|---|---|---|---|
| Market Capitalization to GDP (2024) | 136.0% | 65.0% | Data Not Standardized | 37.0% |
| FDI Inflows to GDP (Historical Avg) | ~2.0% - 2.5% | ~1.5% | 4.8% | ~3.0% |
| Projected Real GDP Growth (FY26) | 7.4% | ~4.5% | 6.5% - 7.1% | ~2.0% |
Data synthesized from global economic outlooks, the Economic Survey 2025-26, and OECD reviews. 2
The Indian infrastructure ecosystem currently exhibits a dichotomy. National highways, renewable energy capacity, and digital public infrastructure showcase world-class deployment speeds and scale.1 Conversely, urban municipal systems, land-use regulations, and local power distribution networks remain constrained by legacy bottlenecks, regulatory fragmentation, and profound deficits in municipal finance.10 Infrastructure systems do not operate in silos; they are deeply interconnected networks where the efficacy of one dimension directly dictates the performance of another. Therefore, a multidimensional empirical evaluation is necessary to assess the actual operational efficiency, spatial equity, and governance capacity of these investments. By synthesizing spatial data, econometric evaluations, and project-level performance metrics, this report deconstructs the structural constraints and identifies the second and third-order economic impacts of infrastructure deployment across the subcontinent.
Logistics Efficiency, Spatial Sorting, and Supply Chain Competitiveness
Logistics infrastructure serves as the circulatory system of the industrial economy. Historically, India’s supply chain competitiveness was severely undermined by highly fragmented networks, sub-optimal modal mixes, and exorbitant transit delays at ports and state borders. Recent empirical assessments, however, indicate a structural paradigm shift driven by integrated policy frameworks and massive capital deployment.
Aggregate Cost Reductions and Global Benchmarking
A robust, data-driven evaluation conducted by the National Council of Applied Economic Research (NCAER) and the Department for Promotion of Industry and Internal Trade (DPIIT) estimates India’s national logistics cost at 7.97 percent of GDP for the 2023–2024 period.12 This reassessed figure places India in closer alignment with advanced economies and represents a significant efficiency gain over historical estimates that frequently and informally placed Indian logistics costs in the double digits, often cited around 13 to 14 percent.13 This aggregate reduction translates to massive systemic savings, enhancing the cost-competitiveness of Indian exports and aligning directly with the objectives of the National Logistics Policy (NLP) 2022, which explicitly targets reducing logistics costs to global benchmarks.14
The international response to these domestic improvements is reflected in the World Bank’s Logistics Performance Index (LPI) 2023, where India advanced six places to rank 38th out of 139 nations.16 This progression reflects targeted improvements in customs clearances, infrastructure quality, and tracking capabilities. However, the government has set an ambitious target of reaching the top 25 globally by 2030, which requires continuous benchmarking against regional competitors and global leaders.9
| Country | LPI Rank (2023) | LPI Score (2023) | Customs Score | Infrastructure Score | Timeliness Score |
|---|---|---|---|---|---|
| Singapore | 1 | 4.3 | 4.2 | 4.4 | 4.3 |
| India | 38 | 3.4 | 3.3 | 3.4 | 3.5 |
| Vietnam | 43 | 3.3 | 3.1 | 3.2 | 3.4 |
| Brazil | 51 | 3.2 | 2.9 | 3.2 | 3.5 |
| Indonesia | 61 | 3.0 | 2.8 | 2.9 | 3.3 |
Source: World Bank Logistics Performance Index 2023. 18
The operational improvements are acutely visible at critical nodes such as maritime ports and aviation hubs. Upgrades executed under the Maritime India Vision 2030 and Maritime Amrit Kaal Vision 2047 have brought the average container vessel turnaround time at the Nhava Sheva (JNPT) Port to approximately one day, highly competitive against the 0.75-day benchmark set by global leaders like Singapore.17 Simultaneously, the civil aviation sector has undergone rapid expansion. India has emerged as the world's third-largest domestic aviation market, expanding from 74 airports in 2014 to 164 in 2025, with air cargo volumes growing from 2.53 million metric tonnes (MMT) in FY15 to 3.72 MMT in FY25.23
Empirical Impacts of Highway Upgrades: The Golden Quadrilateral
The economic externalities generated by logistics infrastructure extend far beyond simple transit time reductions. Empirical evaluations of large-scale transport corridors, specifically the Golden Quadrilateral (GQ) highway project, reveal substantial second-order benefits for the manufacturing sector. The GQ project upgraded the quality and width of 5,846 kilometers of roads connecting major metropolitan centers. Utilizing difference-in-difference estimation strategies, economists investigated the impact of this network on non-nodal districts based on their distance from the highway system.24
The analysis reveals that non-nodal districts located within 0–10 kilometers of the GQ network experienced significantly higher plant entry rates and productivity increases compared to districts 10–50 kilometers away.24 The reduction in transportation frictions precipitated a sharp decline in intermediate input prices; plants within 25 kilometers of the GQ saw input prices fall 50 percent more than those located further away.26 Ultimately, the GQ project increased the real income of India’s manufacturing sector by 2.72 percent—equivalent to USD 4.2 billion at the time of the study—allowing the initial construction cost of USD 5.6 billion to be recouped in less than two years.26
These findings underscore the massive multiplier effect embedded in transport infrastructure. Furthermore, the data indicates that such infrastructure dictates the spatial sorting of industries. Land-intensive industries actively migrated from highly congested, expensive nodal districts to newly connected, moderate-density non-nodal districts along the GQ network, thereby spreading economic activity and alleviating urban pressure in primary metropolises.24
Systemic Integration via PM Gati Shakti
A persistent historical challenge in Indian infrastructure delivery has been the existence of inter-ministerial silos, leading to uncoordinated planning, duplicate civil works, and extended gestation periods. The PM Gati Shakti National Master Plan, launched in October 2021, directly addresses this via a geographic information system (GIS)-based platform integrating data from over 16 ministries and departments.17 Acting as a nascent Spatial Data Infrastructure (SDI), the platform aligns disparate datasets—from telecom optic fibers and natural gas pipelines to forest boundaries and land records—allowing for integrated, multimodal planning.28
As an empirical measure of its impact, the Network Planning Group (NPG) under the PM Gati Shakti framework has evaluated 352 critical infrastructure projects with a total estimated cost of ₹16.10 lakh crore. Of these, 201 projects have been sanctioned, and 167 are under active implementation.29 The technological integration has drastically compressed planning timelines. For instance, the Ministry of Petroleum and Natural Gas introduced electronic Detail Route Surveys (eDRS), which reduced planning timelines from several months to a single day.30 The Ministry of Railways mapped over 27,000 kilometers of lines and increased Final Location Surveys from 57 in FY21 to 449 in FY22.30
By digitizing planning and embedding a single-window interface for project evaluation, the PM Gati Shakti framework minimizes the risk of ex-post regulatory friction and ensures that infrastructure is built with multimodal connectivity from the inception stage, representing a structural evolution in Indian infrastructure governance.28 To complement physical execution, digital platforms like the Unified Logistics Interface Platform (ULIP) and the Ease-of-Logistics Services (E-Logs) portal have been deployed to provide real-time container tracking and grievance redressal, ensuring systemic transparency across the supply chain.33
Urban Form, Spatial Efficiency, and Congestion Externalities
As India continues its demographic transition, urbanization represents a primary engine of macroeconomic growth. The United Nations Sustainable Development Goals, particularly SDG 11, emphasize the necessity of creating inclusive, safe, resilient, and sustainable cities.34 However, the geometric layout, physical density, and spatial efficiency of Indian cities critically determine whether agglomeration economies yield intended productivity gains or succumb to severe urban diseconomies.
Urban Geometry and Commuting Frictions
Urban economics literature is increasingly pivoting away from merely analyzing population size to focusing on the physical shape and geometry of cities. Research applying satellite-derived datasets of night-time lights and historical maps to Indian urban geometry reveals that the spatial layout heavily dictates commuting efficiency and overall urban productivity.36 Traditional economic models typically assumed cities were circular or radially symmetric, but the empirical reality of Indian urbanization is characterized by "leapfrog" development and fractured expansion due to topographical constraints and poor master planning.37
Utilizing geographical obstacles as an instrumental variable for potential urban shape, empirical analysis embedded within a Roback-Rosen spatial equilibrium framework demonstrates that cities with more compact geometries experience faster population growth and command higher housing rents, indicating a positive consumer willingness to pay for compact layouts.37 Conversely, deteriorating city shape induces severe welfare costs, primarily by increasing transit times and creating spatial mismatches between residential clusters and employment hubs.36
In developing nations where a majority of the population lacks private transportation, poor urban geometry exacerbates inequality. Compact cities exhibit a higher share of affordable housing and slum integration near transit nodes, whereas sprawling, highly irregular cities penalize lower-income workers with prohibitive commuting costs and lost labor hours.39 The spatial mismatch hypothesis suggests that disadvantaged groups residing in peripheral slums face degraded employment well-being because the geographic separation from high-productivity downtown areas lowers their effective wages and limits labor market participation.40
Density Thresholds and Well-Being
The assumption that higher urban density universally correlates with prosperity is challenged by empirical realities in Indian megacities. A high-resolution spatial analysis of Built-up Urban Density (BUD) in Delhi reveals an "inverted compact" form, where population density is perversely higher in the peripheral, unplanned zones than in the established, meticulously planned urban cores.34 Delhi exhibits extreme density variations, ranging from a minimum of 2,884 persons per square kilometer in planned residential areas to over 136,385 persons per square kilometer in peripheral, congested wards.34
While increased density initially supports economies of scale for infrastructure provision—such as piped water and sewerage networks—the relationship is highly non-linear. The study identifies an "optimal threshold" of density. Once this threshold is breached, the positive influence of physical density on human well-being diminishes, and socio-economic disparities become the dominant force dictating living standards.34 In highly congested, unplanned areas, density ceases to be a spatial advantage and becomes an acute environmental and social stressor. For instance, per capita green space in Delhi averages 23.52 square meters, but plunges to near zero in hyper-dense clusters.34
This dynamic demands highly differentiated urban planning strategies. Low-density peripheral zones require planned densification and aggressive infrastructure provisioning to improve resource efficiency. Conversely, high-density, unplanned areas require strategies to alleviate congestion, promote mixed-use development, and enhance core services.34 To effectively monitor these complex urban functions at scale, researchers are increasingly utilizing Point-of-Interest (POI) data—such as datasets from Foursquare Places OS—to measure spatial diversity, cross-national benchmarking, and the distribution of urban functionalities in near real-time, bypassing the limitations of infrequent official census data.42
The Economic Cost of Congestion
The failure to align urban planning with robust public transport infrastructure manifests as chronic road congestion, imposing staggering economic penalties on Indian cities. An empirical evaluation by the Boston Consulting Group (BCG) of four major Indian cities—Delhi, Mumbai, Bengaluru, and Kolkata—estimates the avoidable social cost of congestion at a staggering USD 22 billion annually.43 These costs aggregate wasted fuel, diminished labor productivity, traffic accidents, and heightened air pollution.43
| City | Avoidable Social Cost of Congestion (Annual) | Peak Hour Congestion Level | Potential Congestion Reduction via Shared Mobility |
|---|---|---|---|
| Delhi | USD 9.60 Billion | 129% | 19% |
| Bengaluru | USD 5.92 Billion | 162% | 27% |
| Mumbai | USD 4.80 Billion | 135% | 17% |
| Kolkata | Data Aggregated | 129% | Data Aggregated |
Data denotes peak hour congestion as the percentage of additional time required compared to free-flow conditions. 43
In Bengaluru, peak-hour congestion forces a 162 percent increase in travel time, making it the most congested among the analyzed cities.43 The average level of congestion in Indian cities is significantly higher than in comparable cities across Asia, averaging 149 percent.43 Despite extensive investments in metro rail systems, the rapid proliferation of private vehicle ownership outpaces infrastructure capacity. Surveys indicate that 89 percent of commuters in Delhi and Mumbai plan to purchase a car within the next five years, a trend that threatens to entirely paralyze urban mobility.43
Addressing these externalities requires moving beyond mere capacity expansion. Policy mechanisms such as shared mobility networks are vital; rideshare vehicles average nearly twice the utilization of private cars.43 Furthermore, the Economic Survey 2025–26 actively suggests implementing congestion pricing in dense business districts.46 Taking cues from the electronic road pricing models of Singapore and London, congestion pricing forces private users to absorb the true marginal cost of their road usage, thereby incentivizing public transit adoption, promoting carpooling, optimizing asset utilization, and reclaiming lost urban productivity.45
Housing Affordability, Land-Use Regulations, and Supply Elasticities
The intersection of intense demographic pressure, rapid urbanization, and constrained urban infrastructure has triggered severe housing affordability crises across Indian megacities. Housing supply is inherently inelastic in India, largely due to stringent land-use regulations, cumbersome zoning laws, and inadequate core service provisioning, which artificially constrict the market's ability to respond to demand.11
Floor Space Index (FSI) and Supply Constraints
Unlike many global cities that regulate land use dynamically to accommodate growth, Indian urban planning has historically relied on rigid and restrictive Floor Space Index (FSI) or Floor Area Ratio (FAR) caps. These caps strictly dictate the maximum permissible built-up area on a given land parcel. Empirical research indicates that restrictive FSI regulations severely depress housing supply elasticity.47 For instance, comparative data reveals dramatic inter-state variance in long-run durable housing supply elasticities: Maharashtra exhibits a relatively responsive elasticity of 3.06, which is comparable to cities like Austin in the United States. Conversely, states like Bihar (0.49) and West Bengal (0.38) rank significantly below even geographically constrained and highly regulated US markets like Miami or Los Angeles.11
When FSI regulations are relaxed, the real estate market responds rapidly. Studies tracking within-city deregulation demonstrate that increasing allowable FSI leads to population suburbanization as developers build higher-density residential clusters.11 However, the assumption that increased FAR automatically yields affordable housing for the urban poor is highly nuanced. Developers frequently exploit newly available floor space to increase apartment sizes or add shared luxury amenities rather than multiplying the number of low-income units.50
To combat this and generate municipal revenue, cities like Hyderabad have experimented with linking maximum achievable density to abutting road widths or imposing impact-linked fees to capture land value for civic infrastructure.48 Furthermore, overly restrictive regulations generate spatial economic disparities. For example, in Hyderabad's HITEC City, a high FSI of 4.0 correlates with high land prices (₹15,000/sq. ft.) and low housing affordability, but also exposes severe deficits in water supply infrastructure, with demand outstripping supply by 20 percent.51 Artificially constrained vertical growth continues to drive urban sprawl, pushing the poor to the metropolitan periphery—often beyond greenbelts like those surrounding Bengaluru—where land is cheaper but infrastructure is entirely absent, thereby exacerbating the spatial mismatch.52
Affordability Dynamics and Demand-Side Preferences
Bengaluru provides a stark case study of contemporary affordability constraints. The city's sustained expansion, driven largely by the technology and services sectors, has generated relentless housing demand. However, limited land availability in well-connected areas and soaring input costs related to construction and regulatory compliance have driven property valuations up rapidly.53 Escalating ticket sizes—frequently exceeding ₹1 crore for standard units—strain the financing capacity of middle-income households, increasing loan-to-value requirements and delaying purchase decisions, particularly for first-time homebuyers.53
However, empirical analysis from the World Bank provides critical insights into the underlying drivers of this demand. Hedonic pricing models demonstrate that housing demand in urban India is highly income-elastic, meaning that as household incomes rise, expenditure on housing increases significantly.54 Crucially, this high elasticity is not driven merely by the desire for larger physical space, but by a profound willingness to pay for bundled core amenities—specifically, improved piped water and sanitation.54 Urban households treat the acquisition of housing with reliable utilities as an implicit investment in the health and nutrition of their families.
Rental markets, meanwhile, are showing signs of increased efficiency. Emerging from the shadow of legacy rent control laws, rental pricing in megacities is aligning more closely with sales prices, and affordability for renters—measured via the residual income method—has improved in tandem with general poverty reduction.54
These findings provoke a fundamental recalibration of housing policy. The data suggests that demand-side interventions, such as direct household subsidies, are economically inefficient given the already high latent demand and willingness to pay.54 Instead, public capital should be redirected toward the supply side—specifically, aggressive investments in municipal water, sewerage, and transport connectivity. By providing serviced, development-ready land, governments can organically elevate the elasticity of housing supply, mitigating affordability crises more effectively than through targeted financial subsidies.54 To support low-income segments, India could adopt comparative models such as Vietnam’s Nam Long affordable housing project, which successfully utilized a blend of corporate bonds, private equity, and philanthropic grants, or the establishment of localized Housing Trust Funds backed by dedicated revenue sources like real estate transfer taxes.57
Water, Sanitation Infrastructure, and Labor Productivity
The provision of clean water and safe sanitation represents the most fundamental layer of infrastructure, carrying profound implications for public health, human capital accumulation, and labor productivity. India has undertaken massive state-led interventions to close historical deficits in these sectors, yielding measurable empirical improvements.
The Swachh Bharat Mission and Jal Jeevan Mission
The Swachh Bharat Mission-Grameen (SBM-G), launched in 2014, achieved rapid progress in eradicating open defecation. By October 2019, all villages declared themselves Open Defecation Free (ODF), with the number of people lacking access to toilets reducing by an estimated 450 million.58 The ongoing Phase II of SBM-G (2020–21 to 2024–25), operating with an allocation of ₹1.4 lakh crore, focuses on sustainability, solid and liquid waste management, and retrofitting single-pit toilets to twin-pit technology to allow for better sludge management.58 Similarly, the Swachh Bharat Mission-Urban 2.0 has been approved with a financial outlay of ₹1,41,600 crore, targeting the complete elimination of hazardous entry into sewers, achieving ODF++ status in smaller cities, and ensuring no untreated wastewater pollutes water bodies.61
Complementing sanitation efforts, the Jal Jeevan Mission (JJM), launched in 2019, aims to provide safely managed drinking water (SMDW) services to all rural households through individual tap connections.62 By October 2025, over 81 percent of rural households had access to clean tap water, representing a massive infrastructural scale-up.1 The JJM operates on principles aligned with the WHO/UNICEF Joint Monitoring Programme, ensuring water is accessible on premises, available when needed, and free from contamination.63 International collaborations, such as the Indo-Danish Water Technology Alliance, are further enhancing capacities in wastewater treatment and energy optimization within the water sector.62
Health Externalities and Economic Productivity
The economic returns on water and sanitation infrastructure are generated primarily through the mitigation of health externalities. Unsafe drinking water and inadequate sanitation are globally responsible for immense burdens of disease, quantified in millions of Disability-Adjusted Life Years (DALYs).63 Historically, poor sanitation in India contributed to nearly 100,000 diarrheal deaths annually among children under five.59 Empirical studies confirm that infrastructure provision leads to significant decreases in the incidence of acute intestinal infections among children.64
However, the impacts extend beyond child mortality into adult labor productivity. While some studies suggest the direct health impacts on adults are less pronounced, the provision of water infrastructure makes households significantly better off by permitting a reallocation of labor.64 Time savings derived from a decreased burden of water collection—a task predominantly shouldered by women—allow for increased participation in income-generating activities or agricultural production. Furthermore, at the macroeconomic level, improved water and sanitation infrastructure directly supports higher output and labor productivity across manufacturing and services sectors, ensuring a healthier, more reliable workforce.65
Energy Reliability, Industrial Productivity, and Transition Dynamics
The reliability of electrical infrastructure represents a non-negotiable prerequisite for industrial competitiveness. While India has made immense strides in total generation capacity—particularly with renewable energy reaching 49.83 percent of total installed capacity by late 2025—the consistency of supply at the firm level ultimately dictates economic outcomes.1
The Microeconomic Penalty of Power Shortages
Empirical evidence demonstrates that power outages act as a severe, regressive tax on industrial output. Utilizing instrumental variable approaches based on hydroelectric reservoir inflows, economists estimate that India's average reported levels of electricity shortages reduce the revenue and producer surplus of an average manufacturing plant by 5 to 10 percent.67
Interestingly, when evaluated using hybrid Leontief/Cobb-Douglas production function models, the Total Factor Productivity (TFP) losses are found to be significantly smaller than the revenue losses. This discrepancy occurs because manufacturers adapt by storing non-energy inputs during outages or shifting production schedules—such as textile plants relying on planned "power holidays" to mitigate disruption.67 While these coping mechanisms prevent an immediate collapse of productivity, they impose rigidities that hinder optimal capacity utilization.
Distortions in Industrial Structure: The Missing Middle
Beyond immediate revenue losses, energy unreliability creates pernicious, long-term distortions in the structural distribution of firms. Because unpredictable power outages are pervasive, plants are forced to invest in captive diesel generators.67 However, generator costs exhibit massive economies of scale. Large, highly capitalized firms can absorb the fixed costs of industrial-scale generators relatively easily, whereas micro, small, and medium enterprises (MSMEs) cannot.67
Consequently, electricity shortages disproportionately penalize small plants, either forcing them out of the market or preventing their expansion. This dynamic acts as an artificial barrier to scale, contributing to the "missing middle" phenomenon prevalent in the manufacturing sectors of developing economies. By inadvertently subsidizing large incumbents who can afford resilience, poor grid reliability suppresses dynamic market competition and overall industrial dynamism.67
Monitoring Reliability and Energy Efficiency
To combat these losses and modernize the grid, state Distribution Companies (DISCOMs) are increasingly mandated by regulatory bodies to track and report global reliability indices such as the System Average Interruption Frequency Index (SAIFI), System Average Interruption Duration Index (SAIDI), and Customer Average Interruption Duration Index (CAIDI).70 Reporting these metrics, while excluding Major Event Days (MEDs) like natural disasters, incentivizes continuous infrastructure hardening.70 Leading private utilities, such as those operating the Mumbai network, demonstrate the efficacy of continuous capital expenditure; they have insulated consumers from national grid failures and achieved drastic reductions in SAIDI and SAIFI metrics, ensuring uninterrupted 24/7 supply even during exogenous shocks.72
Furthermore, industrial energy efficiency is emerging as a critical mechanism to decouple output growth from raw energy consumption. Field experiments offering energy consulting to Indian manufacturing plants in Gujarat revealed that targeted audits and the deployment of part-time engineers to implement recommendations significantly enhanced energy productivity, lowering operational costs and bolstering resilience against supply shocks.73 The transition toward renewable generation introduces new complexities regarding baseload stability, but concurrent investments in utility-scale energy storage and digital grid management are scaling rapidly to meet these challenges.74
Digital Connectivity, Public Infrastructure, and the Urban-Rural Divide
In contemporary economic frameworks, digital connectivity is as foundational as physical roads or power grids. India is recognized globally as one of the fastest digital adopters, propelled by the ubiquity of affordable data, widespread smartphone penetration, and aggressive state-led digitization.76 The country's total internet subscriber base reached 1,002.85 million by mid-2025, facilitating an explosion in digital commerce, governance, and financial inclusion.77
The Spatial Digital Divide and Satellite Connectivity
Despite massive aggregate successes, a spatial digital divide persists, threatening equitable growth. While overall tele-density stands at a robust 85.04 to 86.76 percent, the geographic distribution is highly skewed.1 Urban tele-density operates at saturation levels exceeding 131 percent (indicating multiple connections per user), whereas rural tele-density lags at approximately 58.48 to 59.19 percent.78 Similarly, rural internet penetration hovers around a mere 45 to 46 subscribers per 100 people, compared to over 110 in urban areas.77
| Connectivity Metric | Urban India | Rural India | Overall National |
|---|---|---|---|
| Tele-density (2024-25) | ~131.86% | ~58.48% | ~85.04% |
| Internet Subscribers per 100 pop. | ~110.79 | ~45.03 | ~68.63 |
| Total Internet Subscribers | 561.42 Million | 407.69 Million | ~1,002.85 Million |
Data sourced from TRAI reports and government releases. 77
Bridging this gap relies on deploying next-generation technologies. With 95.15 percent of villages now possessing access to 3G/4G connectivity, terrestrial networks are reaching their geographical limits due to difficult terrain and a lack of economic viability in ultra-remote areas.80 To ensure ubiquitous coverage, the government enacted progressive space sector reforms allowing 100 percent Foreign Direct Investment (FDI) in satellite communications. The entry of Low Earth Orbit (LEO) and Medium Earth Orbit (MEO) satellite internet operators is poised to eliminate remaining connectivity blind spots, ensuring remote and border populations can fully integrate into the national digital economy.77
The Economic Multiplier of Digital Public Infrastructure
The economic returns on digital connectivity are magnified exponentially by India’s pioneering Digital Public Infrastructure (DPI), most notably the Unified Payments Interface (UPI). Empirical research utilizing difference-in-differences methodologies highlights the profound causal impact of UPI adoption on rural economic transformation.81
In sampled rural villages across multiple states between 2019 and 2023, deeper UPI integration led to a 27 percent rise in formal business registrations, a 34 percent increase in savings account utilization, and a remarkable 42 percent growth in female-owned enterprises.81 Concurrently, reliance on informal borrowing dropped by 53 percent, as digital credit trails established formal financial footprints for previously unbanked populations.81 The drastic reduction in transaction costs and the mitigation of information asymmetries allowed micro, small, and medium enterprises (MSMEs) to expand market access well beyond their immediate physical geographies.81 The scale of this ecosystem is immense; in January 2026 alone, UPI handled 21.70 billion transactions worth ₹28.33 lakh crore.84
Furthermore, DPI fundamentally enhances the security and efficiency of other infrastructure sectors. Advanced fraud prevention initiatives, such as the Sanchar Saathi portal and AI-driven detection systems, have identified and disconnected around 330 million fraudulent connections and flagged nearly 9 million suspicious financial transactions, preventing losses of approximately ₹6.6 billion.85 In the logistics sector, digital infrastructure like FASTag (electronic tolling), the GST e-way bill (freight tracking), and the Unified Logistics Interface Platform (ULIP) utilize internet connectivity to eliminate physical checkpoints, drastically accelerating the velocity of freight on highways and generating massive efficiency dividends.33
Governance Capacity, Municipal Finance, and Project Execution
The ultimate determinant of infrastructure quality is the governance architecture that procures, finances, and manages it. While India demonstrates high institutional capacity for executing macro-level projects (e.g., national highways, digital networks), severe structural bottlenecks persist at the sub-national and municipal levels, heavily dictating the pace of implementation.
The Crisis of Municipal Finance and Absorptive Capacity
Urban Local Bodies (ULBs) in India suffer from systemic fiscal starvation and exceedingly low absorptive capacity. Between FY11 and FY18, investment in basic municipal services accounted for only 0.48 percent of GDP, falling far short of target benchmarks set by expert committees.10 This underinvestment is rooted in a highly constrained municipal revenue model. Indian cities extract minimal Own-Source Revenues (OSR) relative to their economic footprint; property tax collections remain structurally weak, and cost recovery mechanisms for basic utilities like water and sanitation are virtually non-existent when compared to peer developing nations.10
Consequently, ULBs operate with negligible operating surpluses, utilizing a mere 15 percent of their revenue surplus to fund capital expenditures on a "pay-as-you-go" basis.10 This fiscal weakness forces a profound dependency on intergovernmental fiscal transfers, which account for 72 percent of total urban investment.10 Because their balance sheets are fundamentally weak, ULBs cannot access commercial debt markets or float municipal bonds effectively, limiting commercial financing to a negligible 5 percent of urban capex.10 Even when regulatory frameworks are streamlined by agencies like SEBI to encourage municipal bonds, the heavy compliance burden often incentivizes ULBs to fall back on standard bank loans.10
Furthermore, the lack of financial autonomy breeds weak administrative absorptive capacity. Even when central funds are allocated, execution rates lag severely at the local level; flagship initiatives like the Smart Cities Mission and the Atal Mission for Rejuvenation and Urban Transformation (AMRUT) witnessed execution rates of only 22 percent and 18 percent, respectively, during critical review periods.10
PPPs, Regional Disparities, and Institutional Collective Action
To bridge the massive financing gap, India has extensively utilized Public-Private Partnerships (PPPs), ranking second globally in the number of Private Sector Participation Initiatives.86 However, the success of the PPP model is highly asymmetrical.
Spatially, there is massive inequality. Economically developed states capture over 50 percent of all PPP investments, while historically underdeveloped regions attract almost zero private participation.86 Sectorally, private capital flocks to high-visibility, toll-generating transport projects (national highways and airports), leaving critical social infrastructure (health, education, and municipal water) entirely dependent on strained public budgets.86
The empirical evidence underscores that private capital deployment is highly sensitive to institutional risk. A primary constraint is the absence of effective inter-agency coordination, leading to Institutional Collective Action (ICA) problems.87 Urban planning is fraught with fragmented, overlapping jurisdictions—such as municipal corporations, development authorities, and traffic police—which stymies coherent master planning and project execution.87 A case study of the Delhi Smart City Mission revealed that high-visibility interventions were mostly confined to the NDMC zone (covering just 3 percent of the city), heavily hindered by unclear property ownership, limited public input, and siloed administrative duties.89 Conversely, cities that demonstrate strong institutional adaptation, localized planning, and inclusive governance—such as Surat and Ahmedabad in their climate resilience strategies—fare much better in executing complex urban projects.91
Land Acquisition, Titling, and Regulatory Reforms
Land acquisition remains the single largest operational bottleneck, historically accounting for 50 percent of infrastructure project delays and leaving massive capital investments stalled.92 The complex socio-legal landscape surrounding land titling makes acquisition highly litigious and politically sensitive. While the Right to Fair Compensation and Transparency in Land Acquisition, Rehabilitation and Resettlement (RFCTLARR) Act aimed to mandate fair compensation, it frequently extended procurement timelines due to rigid procedural requirements. Furthermore, land ceiling legislations aimed at redistribution have led to land fragmentation, requiring developers to negotiate with a multitude of small landholders and exponentially increasing transaction costs.94
Empirical analysis indicates that successful projects often rely on authorities bypassing rigid statutory protocols in favor of dynamic, "value-based" informal control mechanisms. By engaging in flexible negotiations to secure mutually satisfactory compensation arrangements with displaced communities, authorities achieve faster resolution than relying solely on rigid legal frameworks.92 The complexities of land titling in developing nations are well documented globally; similar to observations in Latin American rural and urban titling programs, establishing clear property rights is essential for facilitating investment and labor mobility, yet remains a fraught and lengthy process.95
To circumvent broader regulatory sclerosis, the central government has deployed aggressive single-window clearance frameworks. The National Single Window System (NSWS) has processed over 8.29 lakh approvals, successfully consolidating clearances across 32 Central Departments and 32 States.84 By converging upstream environmental clearances and downstream operational approvals into digitized workflows, the state is actively stripping away the bureaucratic friction that historically deterred investment.31 In highly complex and capital-intensive domains like semiconductor fabrication—where speed to market is paramount—these streamlined pathways have allowed India to swiftly approve 10 major fabrication and assembly facilities, positioning the nation competitively within shifting global tech supply chains.96
Conclusion
An exhaustive multidimensional empirical evaluation of India’s infrastructure systems yields a narrative of extraordinary macro-level advancement running parallel to acute micro-level vulnerabilities. The central state has successfully catalyzed a capex-driven boom, erecting a robust backbone of transport logistics, renewable energy capacity, and digital public infrastructure. The dramatic reduction of aggregate logistics costs to 7.97 percent of GDP, the rapid rise in the Logistics Performance Index, and the explosive economic multiplier effects of the Unified Payments Interface and broadband diffusion definitively prove that when state capacity is centralized, digitized, and strategically aligned, India operates at the global frontier.
However, the efficacy of these world-class national networks is heavily diluted at the local terminus. The economic potential of megacities is being actively choked by irrational urban geometries, regressive zoning laws like rigid FSI caps, and systemic municipal finance deficits. A USD 22 billion annual congestion tax is levied upon the urban workforce by gridlocked streets, while the inelasticity of housing supply denies millions access to affordable shelter and bundled core services. Furthermore, energy unreliability, though improving via smart grid investments, continues to act as a regressive tax that penalizes small and medium enterprises, suppressing competitive dynamism and contributing to structural distortions.
To fulfill the ambitious mandate of the Economic Survey 2025–26—balancing the sprint for immediate growth with the marathon of long-term resilience—India's infrastructure strategy must undergo a structural pivot. The focus must expand outward from building discrete national corridors to engineering local systemic resilience. This requires the aggressive devolution of financial and administrative autonomy to Urban Local Bodies, the implementation of market-clearing mechanisms like congestion pricing and flexible zoning, and the replacement of fragmented municipal authorities with cohesive metropolitan governance. Only by closing the persistent gap between robust national networks and fractured local ecosystems can India translate its massive capital investments into equitable, inclusive, and globally competitive economic output.
Works cited
- highlights: economic survey 2025-26 - PIB, accessed on March 28, 2026, https://www.pib.gov.in/PressReleasePage.aspx?PRID=2219907
- Economic Survey 2025-26 - PIB, accessed on March 28, 2026, https://www.pib.gov.in/economicsurvey/2026/en/
- India Forward: Emerging Perspectives - S&P Global, accessed on March 28, 2026, https://www.spglobal.com/content/dam/spglobal/global-assets/en/special-reports/india-forward/0924_IndiaForwardVolume1.pdf
- Economic Survey 2025-26 Highlights - Union Budget, accessed on March 28, 2026, https://www.indiabudget.gov.in/economicsurvey/doc/Infographics%20English.pdf
- Strengthening the macroeconomic foundations for growth: OECD Economic Surveys: Viet Nam 2025, accessed on March 28, 2026, https://www.oecd.org/en/publications/oecd-economic-surveys-viet-nam-2025_fb37254b-en/full-report/strengthening-the-macroeconomic-foundations-for-growth_b6ed9c4e.html
- summary of economic survey 2024-25 - PIB, accessed on March 28, 2026, https://www.pib.gov.in/PressReleasePage.aspx?PRID=2097921
- ASEAN Investment Report 2025 - Foreign Direct Investment and Supply Chain Development, accessed on March 28, 2026, https://asean.org/wp-content/uploads/2025/10/AIR2025_rev17-Okt.pdf
- Southeast Asia quarterly economic review: Q3 2025 - McKinsey, accessed on March 28, 2026, https://www.mckinsey.com/featured-insights/future-of-asia/southeast-asia-quarterly-economic-review
- Gati Se Pragati 2025 Report | Grant Thornton Bharat, accessed on March 28, 2026, https://www.grantthornton.in/insights/thought-leadership/gati-se-pragati-2025/
- Financing India's urban infrastructure needs - World Bank Document, accessed on March 28, 2026, https://documents1.worldbank.org/curated/en/099615110042225105/pdf/P17130200d91fc0da0ac610a1e3e1a664d4.pdf
- Impact of Land Use Regulations: Evidence from India's Cities - ResearchGate, accessed on March 28, 2026, https://www.researchgate.net/publication/227575470_Impact_of_Land_Use_Regulations_Evidence_from_India's_Cities
- From Growth Engine to Global Edge: Supercharging India's Logistics - PIB, accessed on March 28, 2026, https://www.pib.gov.in/PressReleasePage.aspx?PRID=2195125
- India joins the advanced economies with reassessed 7.97% logistics cost to GDP - ET Infra, accessed on March 28, 2026, https://infra.economictimes.indiatimes.com/news/logistics/india-joins-the-advanced-economies-with-reassessed-7-97-logistics-cost-to-gdp/126075276
- Assessment of Logistics Cost in India, accessed on March 28, 2026, https://master-dpiit.digifootprint.gov.in/static/uploads/2025/09/7d467e0f4aee2362e4bf90b84b7a5332.pdf
- India Marks Three Years of National Logistics Policy: Transforming India's Supply Chain Ecosystem - PIB, accessed on March 28, 2026, https://www.pib.gov.in/PressReleasePage.aspx?PRID=2167224
- India's Ranking in Different Indexes 2025 List - theIAShub, accessed on March 28, 2026, https://theiashub.com/upsc/indias-ranking-in-different-indexes/
- Logistics key for India as a business destination - World Bank, accessed on March 28, 2026, https://www.worldbank.org/en/news/opinion/2024/07/17/logistics-key-for-india-as-a-business-destination
- 2023 | Logistics Performance Index (LPI) - World Bank, accessed on March 28, 2026, https://lpi.worldbank.org/international/global
- Connecting to compete 2023 - Logistics Performance Index - World Bank, accessed on March 28, 2026, https://lpi.worldbank.org/sites/default/files/2023-04/LPI_2023_report_with_layout.pdf
- International Scorecard Page | Logistics Performance Index (LPI) - World Bank, accessed on March 28, 2026, https://lpi.worldbank.org/international/scorecard/radar/C/IDN/2023
- International Scorecard Page | Logistics Performance Index (LPI) - World Bank, accessed on March 28, 2026, https://lpi.worldbank.org/index.php/international/scorecard/line/C/IND/2023
- International Scorecard Page | Logistics Performance Index (LPI) - World Bank, accessed on March 28, 2026, https://lpi.worldbank.org/index.php/international/scorecard/line/C/BRA/2023
- world bank ranks india among the top five countries in terms of private investment in infrastructure among low- and middle-income economies - PIB, accessed on March 28, 2026, https://www.pib.gov.in/PressReleasePage.aspx?PRID=2219991
- Publication: Highway to Success: The Impact of the Golden Quadrilateral Project for the Location and Performance of Indian Manufacturing - Harvard DASH, accessed on March 28, 2026, https://dash.harvard.edu/entities/publication/73120378-d9d7-6bd4-e053-0100007fdf3b
- Infrastructure and Finance: Evidence from India's GQ Highway Network - NBER, accessed on March 28, 2026, https://www.nber.org/system/files/working_papers/w31590/w31590.pdf
- Competition and the welfare gains from transportation infrastructure ..., accessed on March 28, 2026, https://voxdev.org/topic/infrastructure/competition-and-welfare-gains-transportation-infrastructure-india
- Highway to Success: The Impact of the Golden Quadrilateral Project for the Location and Performance of Indian Manufacturing - Harvard Business School, accessed on March 28, 2026, https://www.hbs.edu/ris/download.aspx?name=Ghani_Grover_Kerr%20EJ16.compressed.pdf
- Spatial Data Infrastructure for Sustainable Development: Evaluating PM Gati Shakti as India's Geospatial Framework, accessed on March 28, 2026, https://isprs-annals.copernicus.org/articles/X-5-W2-2025/571/2025/isprs-annals-X-5-W2-2025-571-2025.pdf
- PM GatiShakti Network Planning Group Evaluates 352 Infrastructure Projects Worth ₹16.10 Lakh Crore - PIB, accessed on March 28, 2026, https://www.pib.gov.in/PressReleasePage.aspx?PRID=2225805®=3&lang=2
- PM Gati Shakti: India's Next-Generation Infrastructure Blueprint - Makaan Expert, accessed on March 28, 2026, https://makaanexpert.com/2025/05/pm-gati-shakti-indias-next-generation-infrastructure-blueprint/
- Addressing Legal and Regulatory Barriers to Quality Infrastructure Investment in India, Indonesia and the Philippines | OECD, accessed on March 28, 2026, https://www.oecd.org/en/publications/addressing-legal-and-regulatory-barriers-to-quality-infrastructure-investment-in-india-indonesia-and-the-philippines_fb81e1be-en/full-report/india_158f795a.html
- TWO YEARS OF PM GATI SHAKTI: PERFOMANCE APPRAISAL AND WAY AHEAD - IJCRT.org, accessed on March 28, 2026, https://www.ijcrt.org/papers/IJCRT2403507.pdf
- Commentary: Significance and Implications of National Logistics Policy of India, accessed on March 28, 2026, https://gjia.georgetown.edu/2024/02/16/significance-and-implications-of-national-logistics-policy-of-india/
- Impact of urban density on human well-being and sustainable ..., accessed on March 28, 2026, https://pmc.ncbi.nlm.nih.gov/articles/PMC12485110/
- Evaluating urban development and socio-economic disparity in India through nighttime light data, accessed on March 28, 2026, https://www.geogsci.com/EN/10.1007/s11442-024-2299-7
- Cities in Bad Shape: Urban Geometry in India - American Economic Association, accessed on March 28, 2026, https://www.aeaweb.org/articles?id=10.1257/aer.20171673
- Cities in Bad Shape: Urban Geometry in India∗ - Department of Economics, accessed on March 28, 2026, https://econ.la.psu.edu/wp-content/uploads/sites/5/2023/05/copy_of_CityShapeSept2016.pdf
- Cities in Bad Shape: Urban Geometry in India∗ - Marron Institute, accessed on March 28, 2026, https://marroninstitute.nyu.edu/uploads/content/CityShapeHarariMarch2016.pdf
- Cities in Bad Shape: Urban Geometry in India - Jan Stuhler, accessed on March 28, 2026, https://janstuhler.com/wp-content/uploads/2013/06/presentation_harari.pdf
- A Review of Spatial Mismatch Research: Empirical Debate, Theoretical Evolution and Connotation Expansion - MDPI, accessed on March 28, 2026, https://www.mdpi.com/2073-445X/11/7/1049
- Cities in Bad Shape: Urban Geometry in India - Wharton Faculty Platform, accessed on March 28, 2026, https://faculty.wharton.upenn.edu/wp-content/uploads/1970/01/CityShapeSept2019-1.pdf
- Developing the Urban Diversity Index (UDI): A Global Comparison of Urban Qualitative Aspect and Its Implications for Sustainable Urban Planning Using POI Data - MDPI, accessed on March 28, 2026, https://www.mdpi.com/2071-1050/17/16/7286
- Unlocking Cities - Boston Consulting Group, accessed on March 28, 2026, https://web-assets.bcg.com/img-src/BCG-Unlocking-Cities-Ridesharing-India_tcm9-185213.pdf
- The Uber BCG Study: Need for ridesharing in India more NOW than EVER, accessed on March 28, 2026, https://www.uber.com/in/en/newsroom/uber-bcg-study-need-ridesharing-india-now-ever/
- MOVING FORWARD TOGETHER - NITI Aayog, accessed on March 28, 2026, https://www.niti.gov.in/sites/default/files/2023-02/Shared-mobility.pdf
- Economic Survey 2025-26 suggests congestion pricing for dense business districts, accessed on March 28, 2026, https://www.downtoearth.org.in/urbanisation/economic-survey-2025-26-suggests-congestion-pricing-for-dense-business-districts
- Relaxing Floor Area Ratio: Housing Supply & Affordability in India - Geetika Nagpal, accessed on March 28, 2026, https://papers.geetika-nagpal.com/FAR_Mumbai_Nagpal_Gandhi.pdf
- Beyond Rules: Market Logic, Institutional Lag, and the Limits of Floor Space Index Deregulation in Hyderabad - MDPI, accessed on March 28, 2026, https://www.mdpi.com/2073-445X/14/12/2382
- Urban India's housing supply response to migration-induced demand - Ideas for India, accessed on March 28, 2026, https://www.ideasforindia.in/topics/urbanisation/urban-indias-housing-supply-response-to-migration-induced-demand
- Affordable Skylines: Unpacking the Impact of Zoning Relaxation in India. Guest post by Geetika Nagpal. - World Bank Blogs, accessed on March 28, 2026, https://blogs.worldbank.org/en/impactevaluations/affordable-skylines-unpacking-impact-zoning-relaxation-india-guest-post-geetika
- Assessing The Impact Of Floor Space Index (FSI) Regulations On Urban Density And Infrastructure Development In Hyderabad - IJCRT.org, accessed on March 28, 2026, https://www.ijcrt.org/papers/IJCRT25A3197.pdf
- WORKING PAPER NO: 464 Analysing Urban Growth Boundary Effects in the City of Bengaluru - IIM Bangalore, accessed on March 28, 2026, https://www.iimb.ac.in/sites/default/files/2018-07/WP_No._464.pdf
- Bengaluru's Real Estate Crisis: A Housing Affordability Challenge - Aurum PropTech, accessed on March 28, 2026, https://www.aurumproptech.in/pulse/media/bengalurus-real-estate-crisis-a-housing-affordability-challenge
- Housing Demand and Affordability in India - World Bank Document, accessed on March 28, 2026, https://openknowledge.worldbank.org/server/api/core/bitstreams/b09413ae-3d16-5d86-bb8b-8fdeec85f599/content
- Housing Demand and Affordability in India : Implications for Housing Policy - IDEAS/RePEc, accessed on March 28, 2026, https://ideas.repec.org/p/wbk/wbrwps/10031.html
- Peri-Urban Real Estate, Land-Use Changes, and Sustainability Challenges in Bangalore: Lessons from the Global South - MDPI, accessed on March 28, 2026, https://www.mdpi.com/2813-8090/3/1/2
- Affordable Housing in India - Knight Frank, accessed on March 28, 2026, https://content.knightfrank.com/research/2940/documents/en/affordable-housing-in-india-2024-11745.pdf
- Demand for Grants 2024-25 Analysis : Jal Shakti - PRS India, accessed on March 28, 2026, https://prsindia.org/files/budget/budget_parliament/2024/DFG_2024-25_Analysis_Jal_Shakti.pdf
- Water, Sanitation and Hygiene | UNICEF India, accessed on March 28, 2026, https://www.unicef.org/india/what-we-do/water-sanitation-hygiene
- Annual Report 2024-25 - Department of Drinking Water and Sanitation, accessed on March 28, 2026, https://master-jalshakti-ddws.digifootprint.gov.in/static/uploads/2025/03/b411cf0455523419696301fe6c08b262.pdf
- Cabinet approves the continuation of Swachh Bharat Mission (Urban) [SBM U] till 2025-26 for sustainable outcomes - PM India, accessed on March 28, 2026, https://www.pmindia.gov.in/en/news_updates/cabinet-approves-the-continuation-of-swachh-bharat-mission-urban-sbm-u-till-2025-26-for-sustainable-outcomes/
- Annual Report 2023-24 - Department of Drinking Water and Sanitation, accessed on March 28, 2026, https://master-jalshakti-ddws.digifootprint.gov.in/static/uploads/2024/02/b6a78c0a18513c7221a0e4d80ef8b9cb.pdf
- Estimating health gains from increased access to safely managed drinking- water services following Government of India's Jal Jeevan Mission Study, accessed on March 28, 2026, https://jaljeevanmission.gov.in/sites/default/files/2023-09/study-report-of-estimating-health-gains-from-increased-access-to-safely-managed-drinking-water%20services.pdf
- Water Works: The Economic Impact of Water Infrastructure*, accessed on March 28, 2026, https://heep.hks.harvard.edu/file_url/143
- Impact of infrastructure on output, productivity and efficiency: Evidence from the Indian manufacturing industry - Emerald Publishing, accessed on March 28, 2026, https://www.emerald.com/igdr/article/3/2/100/105013/Impact-of-infrastructure-on-output-productivity
- Site Amenities and Workers' Welfare Factors Affecting Workforce Productivity in Indian Construction Projects - ASCE Library, accessed on March 28, 2026, https://ascelibrary.org/doi/10.1061/%28ASCE%29CO.1943-7862.0001566
- How Do Electricity Shortages Affect Industry? Evidence from India † - ResearchGate, accessed on March 28, 2026, https://www.researchgate.net/publication/296474845_How_Do_Electricity_Shortages_Affect_Industry_Evidence_from_India
- How Do Electricity Shortages Affect Industry? Evidence from India, accessed on March 28, 2026, https://www.aeaweb.org/articles?id=10.1257/aer.20140389
- NBER WORKING PAPER SERIES HOW DO ELECTRICITY SHORTAGES AFFECT PRODUCTIVITY? EVIDENCE FROM INDIA Hunt Allcott Allan Collard-Wexle, accessed on March 28, 2026, https://economics.yale.edu/sites/default/files/allcottpaper.pdf
- INDIANA UTILITY REGULATORY COMMISSION ELECTRIC UTILITY RELIABILITY REPORT 2024 - IN.gov, accessed on March 28, 2026, https://www.in.gov/iurc/files/Electric-Utility-Reliability-Report-2024.pdf
- September 2025 - The Leap Blog, accessed on March 28, 2026, https://blog.theleapjournal.org/2025/09/
- September 2025 (AEML) - Adani Energy Solutions, accessed on March 28, 2026, https://www.adanienergysolutions.com/-/media/Project/Transmission/Investor/documents/Compliance-Certificates-Latest/AEML-Mumbai_Compliance-Certificate-September-2025.pdf
- Energy Productivity and Energy Demand: Experimental Evidence from Indian Manufacturing Plants - NBER, accessed on March 28, 2026, https://www.nber.org/system/files/working_papers/w24619/w24619.pdf
- Crisil Infrastructure Yearbook 2025, accessed on March 28, 2026, https://www.crisil.com/content/dam/crisilcom2-0/our-analysis/reports/crisil-intelligence/2025/01/crisil-infrastructure-yearbook-2025.pdf
- Single-Window System for PPA Clearance Key to Renewables Growth: Interview, accessed on March 28, 2026, https://www.mercomindia.com/single-window-system-for-ppa-clearance-key-to-renewables-growth-interview
- Digital India: Technology to transform a connected nation | McKinsey, accessed on March 28, 2026, https://www.mckinsey.com/capabilities/tech-and-ai/our-insights/digital-india-technology-to-transform-a-connected-nation
- Satellite Internet in India - PIB, accessed on March 28, 2026, https://www.pib.gov.in/PressNoteDetails.aspx?NoteId=155262&ModuleId=3
- Telecom Regulatory Authority of India The Indian Telecom Services Yearly Performance Indicators 2024-2025, accessed on March 28, 2026, https://www.trai.gov.in/sites/default/files/2025-07/YIR_08072025_0.pdf
- 7th February, 2025 Shri Amit Sharma, Advisor (Financial & Economic Analysis), Telecom Regulatory Authority of India - TRAI, accessed on March 28, 2026, https://www.trai.gov.in/sites/default/files/2025-02/BIF_10022025.pdf
- Universal connectivity and Digital India initiatives reaching to all areas, including tier-2/3 cities and villages - PIB, accessed on March 28, 2026, https://www.pib.gov.in/PressReleasePage.aspx?PRID=2040566
- The impact of digital public infrastructure on financial inclusion and economic growth in rural India: evidence from the UPI revolution - Emerald Publishing, accessed on March 28, 2026, https://www.emerald.com/igdr/article/19/1/109/1330675/The-impact-of-digital-public-infrastructure-on
- Digital Transformation and Economic Growth in India: An Empirical Study - IJPS, accessed on March 28, 2026, https://ijps.in/admin1/upload/01%20Prof.%20B.%20Sudhakar%20Reddy%2001434.pdf
- The Impact of Digital Financial Infrastructure on Economic Growth: Evidence from India, accessed on March 28, 2026, https://www.ijfmr.com/research-paper.php?id=71904
- The Digital Blueprint for Ease of Doing Business - PIB, accessed on March 28, 2026, https://www.pib.gov.in/PressReleasePage.aspx?PRID=2236804®=3&lang=1
- Key Highlights from Economic Survey 2025-26 for Infrastructure sectors, accessed on March 28, 2026, https://indianinfrastructure.com/2026/01/30/key-highlights-from-economic-survey-2025-26-for-infrastructure-sectors/
- Public Private Partnership's Growth Empirics in India's ... - ISEC, accessed on March 28, 2026, https://www.isec.ac.in/wp-content/uploads/2023/07/WP-328-Nagesha-G-and-K-Gayithri.pdf
- Comprehensive Mobility Planning in Indian Cities: Challenges, Gaps, and the Way Forward, accessed on March 28, 2026, https://www.orfonline.org/research/comprehensive-mobility-planning-in-indian-cities-challenges-gaps-and-the-way-forward
- Collaboration Riskscape: Fragmentation, Problem Types and Preference Divergence in Urban Sustainability | Publius: The Journal of Federalism | Oxford Academic, accessed on March 28, 2026, https://academic.oup.com/publius/article/49/2/352/5058953
- View of Bridging Policy and Practice: Evaluating Urban Governance and Implementation Gaps in India's Smart City Mission - A Case Study of Delhi - Ignited Minds Journals, accessed on March 28, 2026, https://ignited.in/index.php/jasrae/article/view/16320/31691
- REFORMS IN URBAN PLANNING CAPACITY IN INDIA - NITI Aayog, accessed on March 28, 2026, https://www.niti.gov.in/sites/default/files/2021-09/UrbanPlanningCapacity-in-India-16092021.pdf
- Urban Adaptation in India: Strategies, Challenges, and Case Studies for Resilient Cities - IJFMR, accessed on March 28, 2026, https://www.ijfmr.com/papers/2025/2/42458.pdf
- Values-Based Control in Land Acquisition for Infrastructure Projects - IDEAS/RePEc, accessed on March 28, 2026, https://ideas.repec.org/h/spr/sprchp/978-3-030-23010-4_14.html
- Akancsha Title - Land Acquisition issues in infrastructure projects Host Organization, accessed on March 28, 2026, https://www.terisas.ac.in/pdf/Major_Project_MBA(BS).pdf
- Land Acquisition and Corporate Investment in India– Impact of the Historical Land Ceiling Legislations* - American Economic Association, accessed on March 28, 2026, https://www.aeaweb.org/conference/2018/preliminary/paper/3N7zkHt5
- RURAL LAND TITLING AND REGULARIZATION PROJECTS Office of Evaluation and Oversight, OVE - IADB Publications, accessed on March 28, 2026, https://publications.iadb.org/publications/english/document/Approach-Paper-Evaluation-of-Rural-Land-Titling-and-Regularization-Projects.pdf
- Semiconductor Industry in India: Incentives and Key Players - India Briefing, accessed on March 28, 2026, https://www.india-briefing.com/news/setting-up-a-semiconductor-fabrication-plant-in-india-what-foreign-investors-should-know-22009.html/