The Asset Trap
77-90% of Indian household wealth sits in real estate and gold, not financial assets that beat inflation—access, not literacy, is the real barrier.
Introduction
Fixed deposit interest rates in India fell from roughly 9–10% in 1999 to about 4–6% by 2021. Inflation didn't decline anywhere near that fast. After tax on interest income, a large share of money parked in FDs over that period has been quietly losing real value, even as the balance kept climbing — which is exactly what makes the loss hard to notice without actually running the numbers. This piece walks through where Indian household wealth actually sits, how each major asset class has performed against inflation, and why "just invest" undersells the real barrier most households face.

Where household wealth actually sits
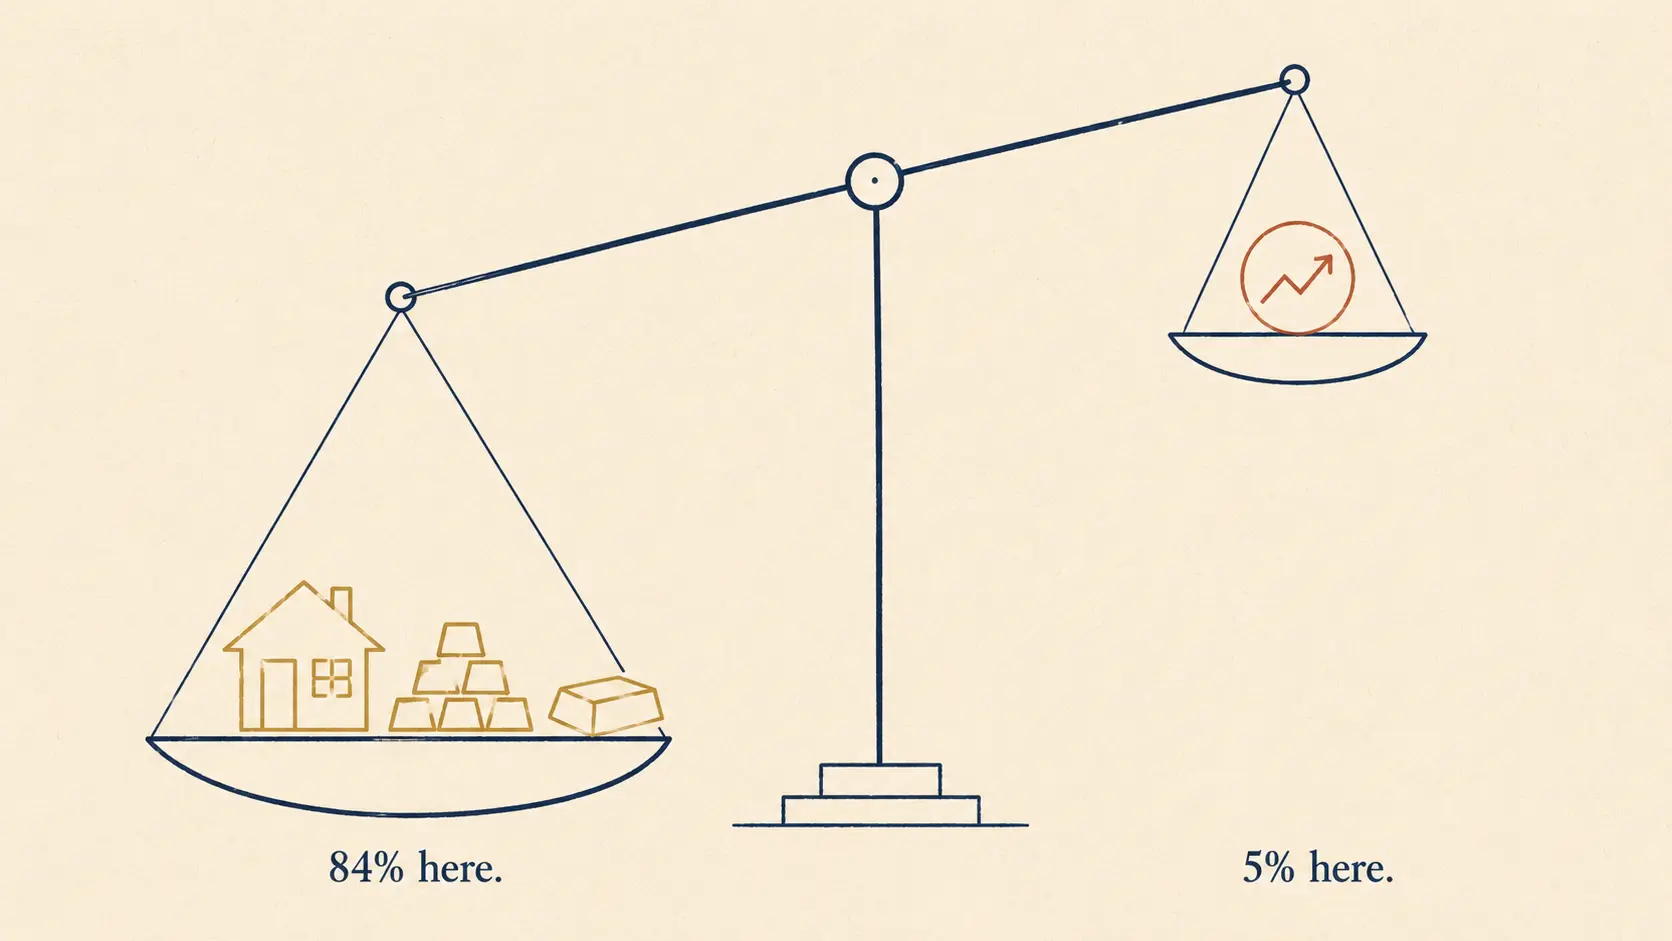
The RBI's 2017 Household Finance Committee report, chaired by Tarun Ramadorai, remains the most-cited single source on this question: the average Indian household allocates about 84% of its wealth to real estate and other physical assets, 11% to gold, and roughly 5% to financial assets of any kind — bank deposits, equity, mutual funds, insurance, combined. Other survey data (the All India Debt and Investment Survey) puts the physical-asset share closer to 77% by count of assets and above 96% on a value-weighted basis, depending on methodology. The two data sources don't align on an exact number, but every version agrees on the underlying shape: financial assets are a small minority holding for the typical Indian household, not the majority one.
Within the small financial-asset share, bank deposits dominate. Direct equity and mutual fund participation are low: AMFI data shows mutual funds rose from about 7.6% of household financial savings in FY21 to 8.4% in FY23 — real growth, from a genuinely low base. NSE's India Ownership Tracker found individual investors, directly and through mutual funds, own about 18.5% of the equity market's free float — a record high, but one reflecting concentrated wealth among a relatively small investor base rather than broad participation. Independent estimates put actual mutual fund participation at roughly 2–3% of the population.
How each asset class has actually performed
| Asset class | Long-run real return pattern | Inflation protection | Liquidity / risk |
|---|---|---|---|
| Savings accounts | Negative | Poor | High liquidity, low risk |
| Fixed deposits | Negative to marginal, especially after tax | Poor | High liquidity, low risk |
| Gold | Positive, variable | Strong | High liquidity, moderate risk, no income |
| Real estate | Positive, wide dispersion by location | Moderate to strong | Low liquidity, moderate risk |
| Equity (Sensex/Nifty) | Strongly positive over long horizons | Strong | High liquidity, high short-term volatility |
| Government bonds | Marginal | Moderate | High liquidity, low risk |

The BSE Sensex, since its 1979 inception, has delivered average annualized returns that beat inflation by a meaningful margin over long holding periods, with the probability of positive real returns rising and volatility falling as the investment horizon lengthens. Gold has similarly beaten inflation over multi-decade horizons, though with more year-to-year variability and no income yield. FDs and savings accounts, by contrast, have often failed to preserve purchasing power once tax on interest is factored in — protecting the nominal balance while eroding what that balance can actually buy.
None of this makes FDs or gold poor individual choices — liquidity, safety, and (for gold specifically) informal-credit usability are real, valuable properties that a diversified equity portfolio doesn't offer in the same way. The pattern only becomes a problem in aggregate, when it describes nearly the entire population's default asset allocation rather than one segment's deliberate risk preference.
Why financial-asset ownership stays this low
The Indian Household Finance Landscape study identifies several structural barriers, distinct from financial literacy:
- Missing or hard-to-reach products. Appropriate financial instruments for lower-income, irregular-income households are limited or poorly distributed.
- Trust gaps. Past mis-selling episodes have left many households wary of formal financial providers, a wariness that doesn't resolve with more advertising.
- Real transaction costs. Documentation, travel time, and account-maintenance costs are meaningful deterrents, especially in rural areas.
- Income volatility. A rigid monthly SIP is a poor fit for informal-sector income that varies month to month, compared to gold, which can be bought in small increments and pawned flexibly through informal credit markets when cash is needed.
- Cultural weight. Gold and land carry social significance — dowry assets, generational security — that a mutual fund statement doesn't replicate.
State-level differences in bank-branch density and public-sector employment explain part of the variation in financial-asset holding across India, pointing to institutional and infrastructure factors rather than purely individual choice.
The reframe
"Financial literacy" is the common diagnosis for why Indian households underinvest in the asset classes that would protect them best against inflation. The evidence points somewhere more structural: access, trust, and transaction cost. That reframing changes what an actual fix looks like — not a bigger investor-education campaign, but cheaper access, better trust infrastructure, and financial products genuinely designed for irregular income, none of which are quick to build.
FAQ
What percentage of Indian household wealth is in financial assets? Roughly 5%, according to the RBI's 2017 Household Finance Committee report — the remainder is split between real estate (the largest share), gold, and durable goods.
Do fixed deposits actually lose money? Not in nominal terms — the balance grows. In real terms, after accounting for tax on interest and multi-decade inflation, FD returns have frequently been negative to marginal, meaning the purchasing power of the money has often declined even as the number on the statement rose.
Why don't more Indians invest in mutual funds or equities? Research points to structural barriers — limited product access, trust gaps from past mis-selling, real transaction costs, and income volatility that doesn't suit rigid investment products — rather than primarily a knowledge gap.
Is gold a good investment in India? It has historically delivered positive real returns and strong inflation protection over multi-decade horizons, alongside high liquidity and cultural trust, though it generates no income and carries moderate price risk.
Related Writing
- business strategy
Why Your Central Bank Wants Some Inflation
The RBI targets 4% inflation, not zero. Why that target exists, who bears the cost, and what CPI vs CFPI reveals.
- business strategy
Structure, Not Conspiracy
Regulatory compliance, protest movements, and poverty data all point to the same conclusion about India's political economy since 1991.
- business strategy
The Billionaire Raj
India's top 1% holds 40.1% of national wealth. A data-first look at wealth concentration, tax incidence, and household debt.
- business strategy
What I Actually Think About India's Next Decade
Closing a 10-week series on Indian institutions, I drop the hedging and say plainly what I believe about reform, timing, and the decade ahead.
- business strategy
The Billionaire Raj: What India's Inequality Actually Costs
India's top 1% income share now exceeds colonial-era levels. This essay examines the specific economic costs of that concentration.